|
A company with the tagline "Grow Your Pharma Business Digitally", Pharmacompass, assembled this data--or at least that was the attribution provided on LinkedIn. I bristle at the scale of revenue and how many link this to innovation or advances in scientific research. True, there are moments of genuine groundbreaking discovery but I would argue they are few and far between.
It is okay to report the revenue but if we are being true stewards to patients, communities, and national health we also need to hold the tension of what might be festering below the surface. 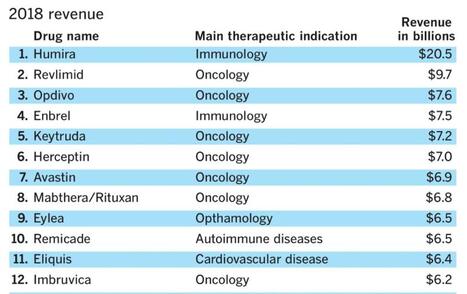
I lecture about prevention upstream from disease quite often--pointing to data that examines water quality, air toxicity, agri-business, social determinants of health, and a wide variety of variables we should be examining in the name of improving health. But like everything in our current environment--profit is king.
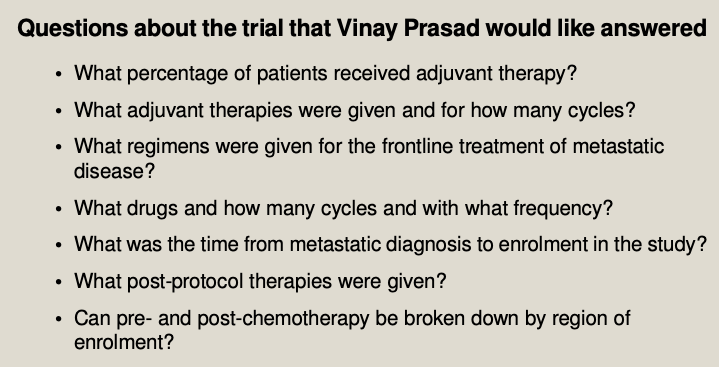
When I tease out metrics of innovation I tend to go more granular than stakeholders prefer. That's okay with me. I no longer accept projects where clients have a clear objective and request data sourcing that supports their premise. Why not formulate the data question and see what data best contributes to the facts? Listen to Vinay Prasad, MD, MPH and hopefully you will become more critical of eminence based medicine and more familiar with evidence based medicine. This particular podcast (link below) where he takes you step by step through a careful review of BEACON clinical trial is riveting. His reasons for being skeptical about the role of medical writers is exactly why I no longer write on assignment. Well, hold on. I would write on assignment if it was less secretarial (write this but not that) and was strictly focused on a 360 perspective of available data--but... Vinay also wrote this editorial in theBMJ, BEACON trial in colorectal cancer is “single worst reported,” says critic You can understand his point when you listen to the podcast either before or after you may have seen the press from ASCO Post Staff: 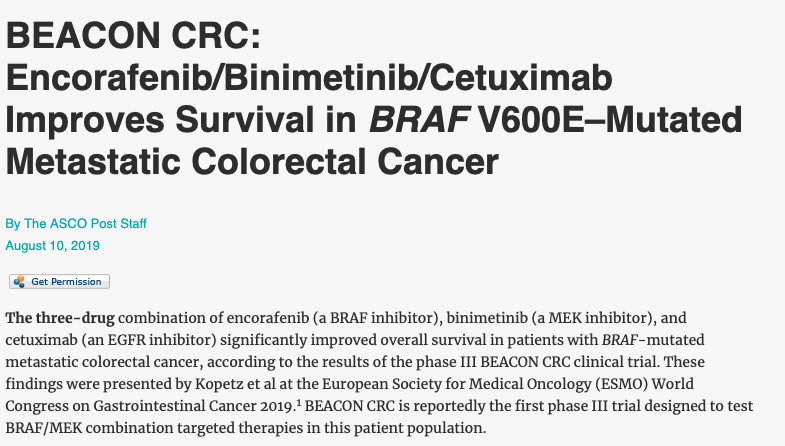
As a recovering medical writer I now rely on data to inform conversations and narratives in medicine, health policy, and health economics. Through a series of workshops I will walk you through a data source and share the tools (free and open source) useful in bringing data into your insights either at the individual or enterprise level.
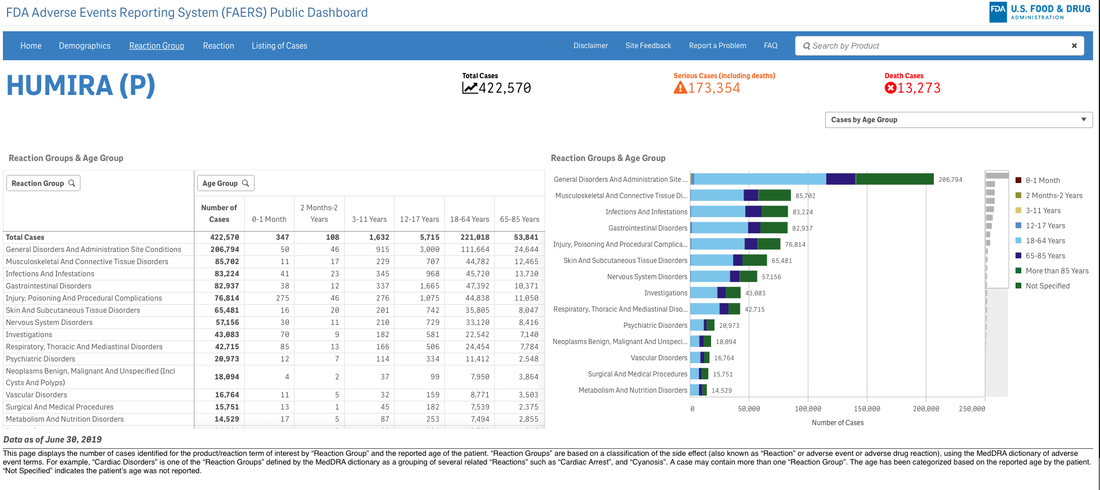
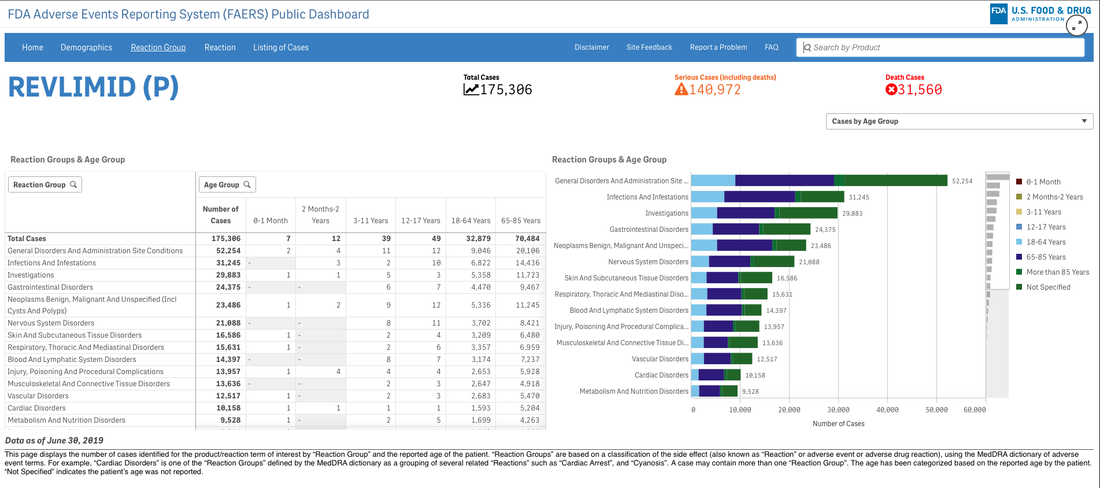
A survey that circulates every year about need assessment writing in continuing medical education continually demonstrates to me that we need these skills. Not the ability to code in Python but the ability to perhaps write a single line of code that can analyze a dataset or generate a visualization. If you are curious about the cost of innovation, here is an easy dashboard you can begin using right now--no data manipulation required. I recommend that you familiarize yourself with the FDA Adverse Events Reporting System (FAERS) Public Dashboard. 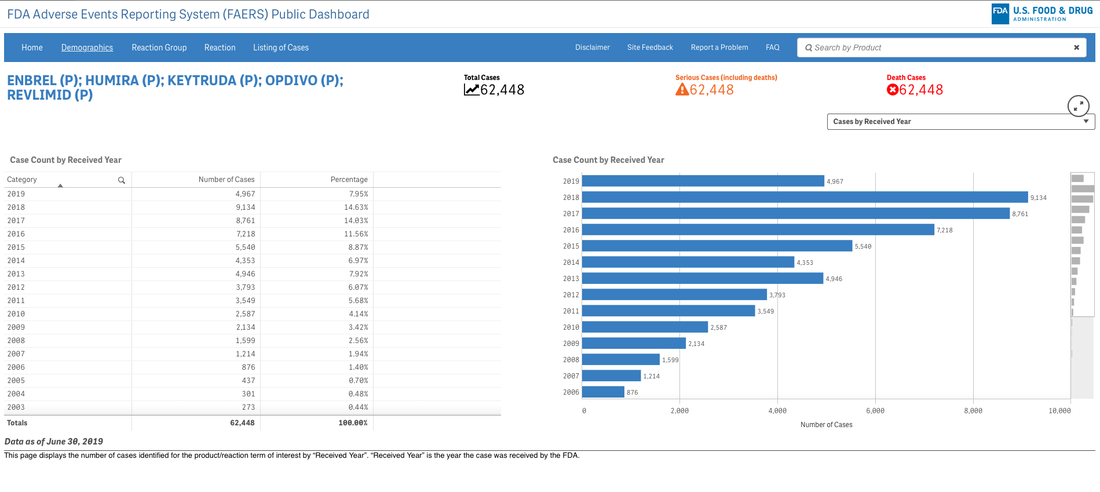
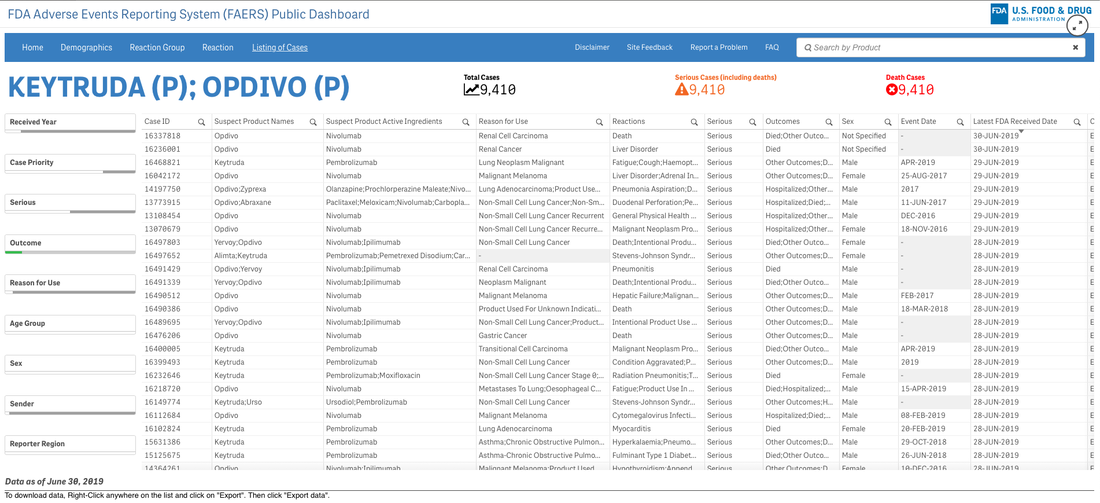
These interactive dashboards available at FAERS website reveal the people and lives behind the dots on a graph. The data is only as complete as those that report the numbers and there are many unanswered questions.
What was the quality of the clinical trials that brought the drugs to market in each indication? What would we think if we knew then what we know now about risk/benefit in a wide variety of heterogeneous populations?
Go to the website and explore the data. Next time someone writes a catchy headline about innovation and how that is captured in the price of investigational products and marketed drugs--ask about the bits they aren't capturing. Someone might just have their finger on the scale...
New workshop: Big data on a less big budget...
Save 25% on Women in Tech Summit with coupon code: SPEAKER25--only a few tickets left!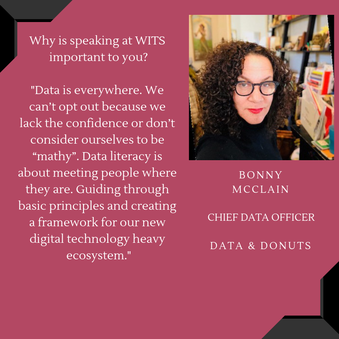
Tableau Fringe Festival 2019--October 25th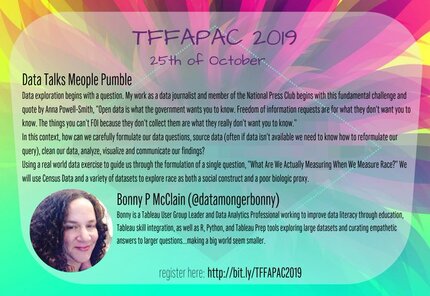
New in 2020...Intro to Data Visualization and Tableau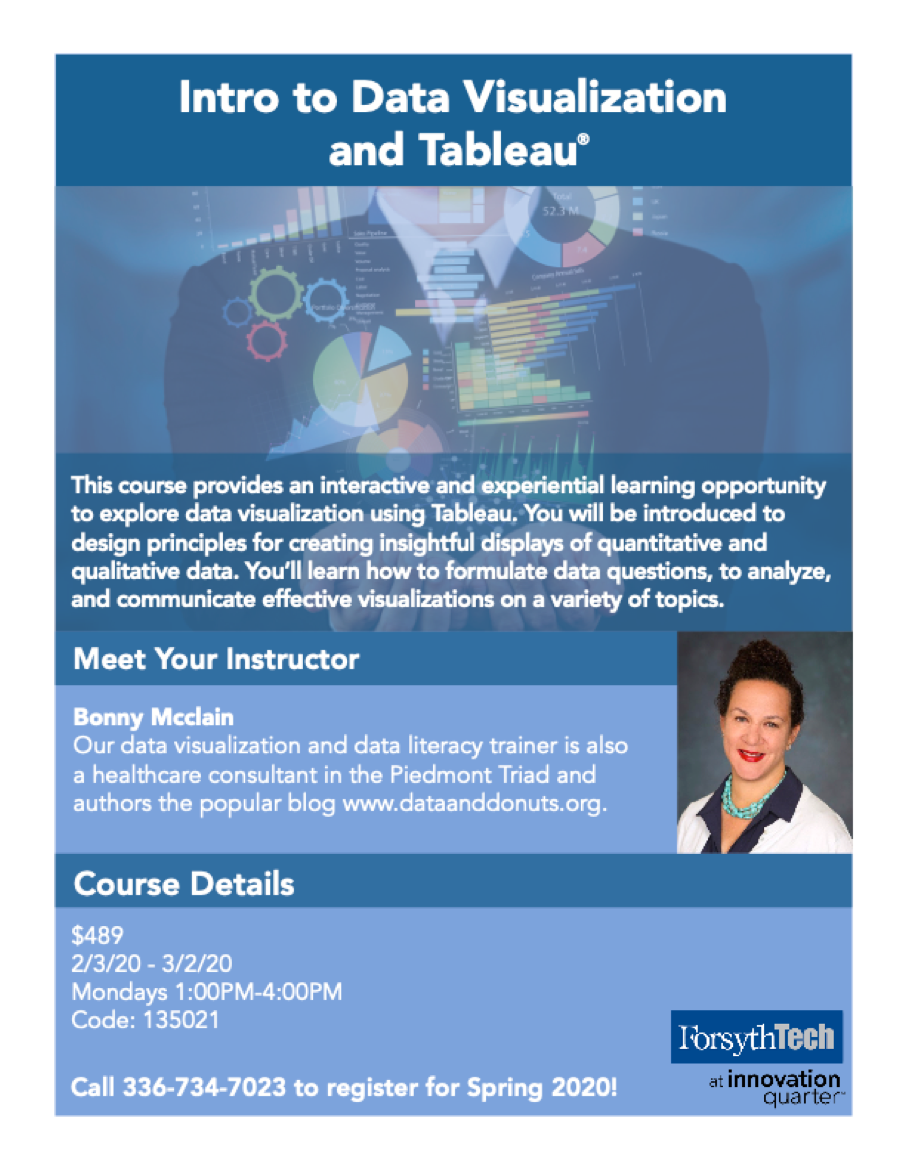
Comments are closed.
|