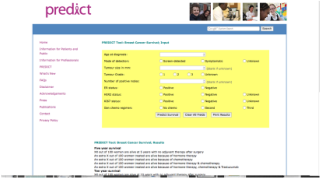
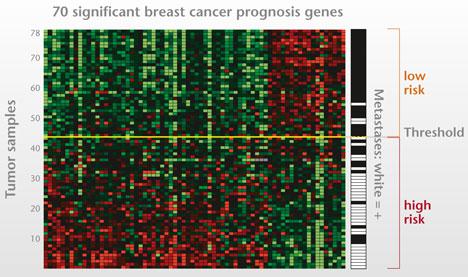
 I presented at a conference in Hawaii where I met my first cardio-oncologist, Monika Leja, MD. As scientists, writers and researchers we often laud a longer life expectancy for many cancer survivors but often neglect the related comorbidities associated with toxic drug regimens contributing to increased mortality. Because the risk of cardio-toxic outcomes depends on type of drug, dose, cumulative dose, dose and schedule of administration, route, other drugs in regimen, inclusion of radiotherapy as well as patient demographics--pre-existing CV risk factors--it is often hard to tease out universal guidance. This context informs the debate around a recent article published in the New England Journal of Medicine. I think it is particularly relevant as the objective of the study is to potentially spare patients chemotherapy regimens with the use of a prediction tool, MammaPrint, a 70-gene signature test. 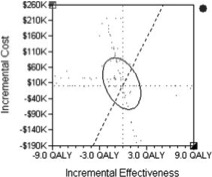 A comparison of two FDA available gene expression profiling tests examined incremental cost effectiveness (ICE). The scatter plot diagram has 4 quadrants running counter clockwise from the upper right corner (I). Quadrant II data points indicate that -- Oncotype DX is more costly and less effective than MammaPrint. Comparatively data points in Quadrant IV suggests that Oncotype DX is less costly and more effective than MammaPrint. The graphic demonstrates the majority of data points are in Quadrant II, indicating that MammaPrint is the dominant strategy. The graphic isn't clearly depicted in the reference article for some reason but the trend is somewhat visible. When looking at efficacy and cost MammaPrint seems like a worthwhile clinical tool. 70-Gene Signature as an Aid to Treatment Decisions in Early-Stage Breast Cancer As described by the study authors, the primary goal was to "provide evidence of the clinical utility of the addition of the 70-gene signature to standard clinical-pathological criteria in selecting patients for adjuvant chemotherapy." Confidence intervals gauge the utility of the data and accuracy of the estimates in the data. You may not be familiar with the one-sided bound described in the paper--lower one-sided bound but it means that 95% of the population is greater than 92% or the non-inferiority boundary. The Adjuvant!Online tool was not available but as an FYI predict looks like an interesting model when looking at baseline characteristics.
In a well-designed clinical trial we assume that authors expect no difference between the two treatment arms (chemotherapy and no chemotherapy for example). We fail to reject the null hypothesis unless we observe strong enough evidence to reject. The null hypothesis actually describes-- no difference between the two groups. The authors here did no such thing. Instead "The primary goal was to assess whether, among patients with high-risk clinical features and a low-risk gene-expression profile who did not receive chemotherapy, the lower boundary of the 95% confidence interval for the rate of 5-year survival without distant metastasis would be 92% (i.e., the noninferiority boundary) or higher." The maximum level of where we reject the null hypothesis is alpha (significance level) and it is typically 0.05. The relevant data is somewhat hard to decipher. If you review the appendix you are reminded that red indicates chemotherapy and blue indicates no chemotherapy. You can also see p-values that should fail to reject the null hypothesis. I can only think that the expanded y axis leads to a bit of the distortion (inset). The disease-free survival (panel C and D) seem to show a benefit for patients on chemotherapy and in Table 2 you observe a P value of 0.03, HR 0.64 and 95% CI (0.43-0.95) 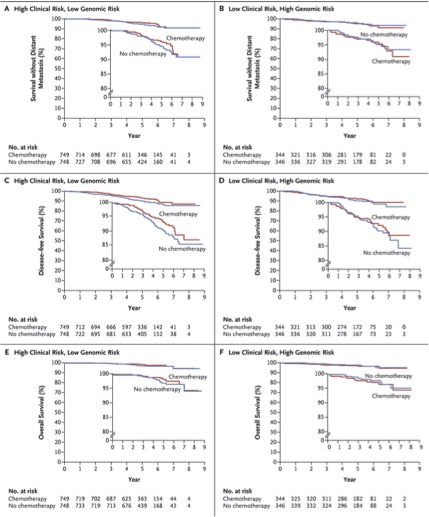 FIgure (from article) Survival without Distant Metastasis, Disease-free Survival, and Overall Survival in the Two Discordant-Risk Groups, According to Randomized Treatment. Shown are the three major survival outcomes — survival without distant metastasis (Panels A and B), disease-free survival (Panels C and D), and overall survival (Panels E and F) — among patients with discordant risk (i.e., high clinical risk and low genomic risk or low clinical risk and high genomic risk), according to the randomized treatment. This analysis was performed in the intention-to-treat population, which included patients who had discordant risk at the time of enrollment and who were analyzed according to treatment assignment. Time-to-event curves were estimated by means of the Kaplan–Meier method. The insets show the same data on an expanded y axis. From the article: RESULTS A total of 1550 patients (23.2%) were deemed to be at high clinical risk and low genomic risk. At 5 years, the rate of survival without distant metastasis in this group was 94.7% (95% confidence interval, 92.5 to 96.2) among those not receiving chemotherapy. The absolute difference in this survival rate between these patients and those who received chemotherapy was 1.5 percentage points, with the rate being lower without chemotherapy. Similar rates of survival without distant metastasis were reported in the subgroup of patients who had estrogen-receptor–positive, human epidermal growth factor receptor 2–negative, and either node-negative or node-positive disease.(also not significant) It is non-trivial to stress that statistical significance is not the same as clinical significance but when the data is so underwhelming how should we decide? The data suggest that it would be a roll of the dice--strictly due to chance. Are you feeling lucky? Thoughtful discussions about content development and outcomes analytics that apply the principles and frameworks of health policy and economics to persistent and perplexing health and health care problems...
The role of a journalist should be to ask questions at the pivot or tension between two widely held beliefs. Similar to politics, there are many shades of grey. For example, consider health policy that may intentionally or unintentionally highlight socioeconomic--based correlates of health. Or industry often vilified in many discussions of cost. We are now evolving "value" based reimbursement strategies that in one tome characterize high-value care (although cost is often left out of the discussion) but also prides itself on the amount of incentives up for grabs if care strategies align with the bottom line--established at the payer, provider, and government level. Collaborative projects for data collection are being implemented and hopefully will grant access to credentialed members of the press to help stimulate the narrative beyond the walls of academia and industry. If the patient is authentically invited to the table--access will be required. In the fiercely competitive pharmaceutical industry, collaboration might seem to be a bridge too far. But there are promising precedents, like Project Data Sphere. In this industry-led platform, launched in 2014, pharmaceutical companies have agreed to share data about nearly 30,000 cancer patients to help develop better clinical trial designs and identify cohorts of patients who don’t benefit from standard chemotherapy. Founding members included Amgen, AstraZeneca, Bayer, Celgene, Janssen, Memorial Sloan Kettering Cancer Center, Pfizer, and Sanofi. If these competitors can share data, so can others.--STAT Many journalists, myself included, have access to public databases as well as curated data sets available behind paywalls that lift for our review. Patient participation in “big data” has contributed to many of the remarkable advancements in cancer treatment over the last decade that might otherwise have gone undiscovered. Take immunotherapy as an example. Never before has the oncology community witnessed such a rapid development in treatment. Clinical trials identified personalized treatments for previously deadly tumor types that improved survival with lower toxicity for some patients.--STAT The patient is theoretically marketed as partners in shared-decision making but are the outcomes censored and marketed with profit and business interests ahead of their own? In the absence of accessible raw-data for rigorous statistical review--we often overstate the outcomes--and under-report the risks. The DrugAbacus interactive tool--although well meaning--seems a wee bit advanced for your average patient unaware of how we evaluate health outcomes when discussing comparitive drug regimens. 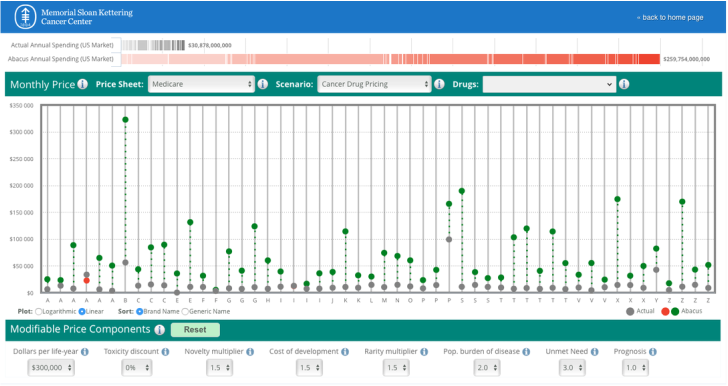 Here is the actual dashboard and queries directed at the end-user, a potential patient looking for a regimen aligned with their own priorities and concerns. 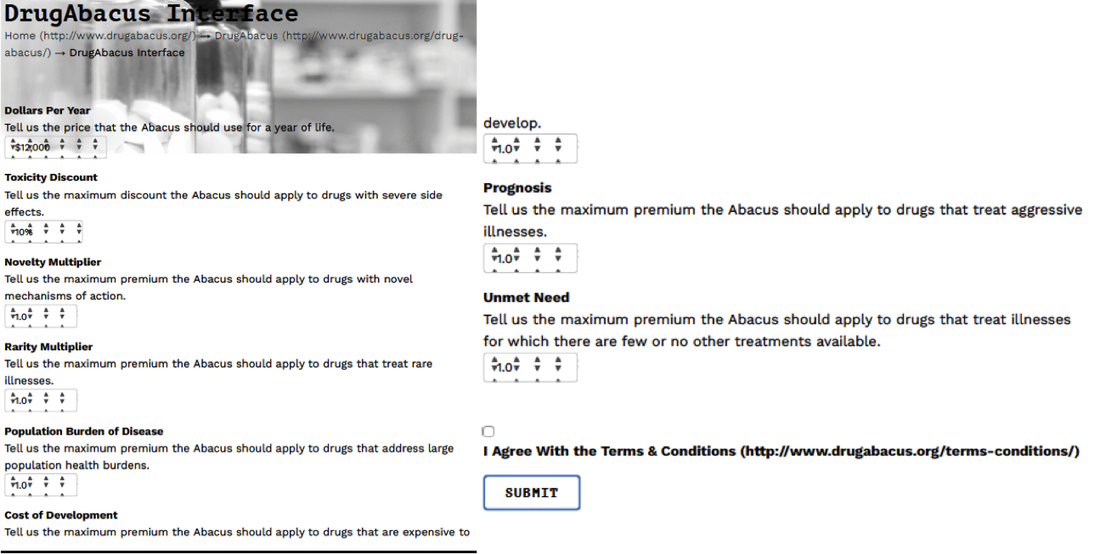 In all the noise--enter in the direct to consumer adverts. Where are the voices to clarify the distortion? Cancer-Drug Ads vs. Cancer-Drug RealityThe voice-over said, “Opdivo significantly increased the chance of living longer versus chemotherapy.” The wording may be a little clumsy, but the velvet-voiced narrator made his point, bolstered by actors portraying lung cancer patients playing with babies and watching Little League games. “A perfection of means, and confusion of aims, seems to be our main problem.” Albert Einstein |