
|
I think the quote, "The Future is already here--It's just not very evenly distributed" is most accurately attributed to William Gibson. I heard it mentioned in passing during a recent London School of Economics and Political Science podcast, Fair Shot: rethinking inequality and how we earn. Chris Hughes had truly innovative ways to rethink how we define and solve inequalities. His new book of the same name is here. Discussions of a basic income guarantee for citizens cite the Permanent Fund Dividend (PFD) paid by the state government to all citizens of Alaska. The state exploits the oil resources and everyone gets a dividend. I am curious if this might be the solution for our healthcare data. We grant access and each participant receives a percentage of the profits generated by the ginormous database. Media headlines in immuno-oncology herald novel and futuristic treatments traveling down industry pipelines to accelerated FDA approvals. But again, far fewer will benefit regardless of the enthusiasm and gargantuan funding for R&D and M&As. This doesn't mean I am against advancements in oncology--quite the opposite. I want to see the data behind the claims and curate insights based on what we know. Not what we "think" we know. I look to leaders in the field such as John Ioannidis, MD and Vinay Prasad, MD not in a sycophantic way but to pay attention to where they are pointing. Estimation of The Percentage of US Patients With Cancer Who Benefit From Genome-Driven Oncology--John Marquart, BA, Emerson Y. Chen, MD, Vinay Prasad, MD, MPHHere is a link to the article. I recommend the granularity and detail presented in the original paper. My interest is always in the data methods and statistical analyses but even if your methodology would vary, the approach is interesting and informative. The authors relied on publicly available data For each drug approval, we catalogued the name of the drug, the date of approval, the specific treatment indication, required genomic testing for that indication, the drug’s mechanism of action, relationship between the genomic aberration and drug target, and the clinical study data, specifically treatment response, per FDA drug label. 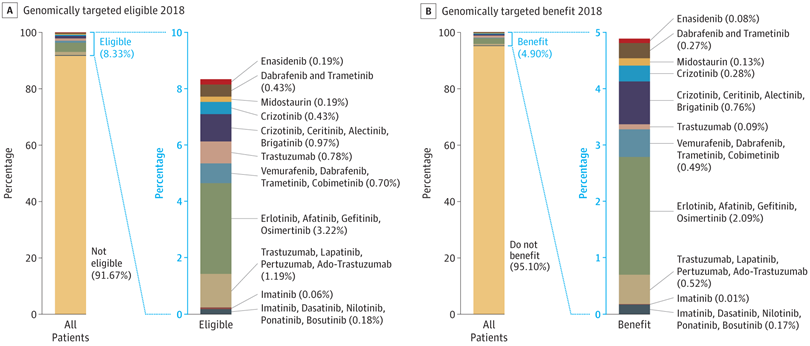 My point in all this is yes, we have made technologic advances but it is only the tippy top of both bars where we can identify eligible patients followed by patients with targeted benefits. We also should be aware that 200+ new drugs approved by the FDA 2010-2016 emanated from tax payer funded research. The figure below is from Galkina Cleary et al., and demonstrates NIH funding year and costs associated with 210 new molecular entities (NME) from 2010-2016 or 151 known molecular targets for these NMEs. "The analysis shows that > 90% of this funding represents basic research related to the biological targets for drug action rather than the drugs themselves." 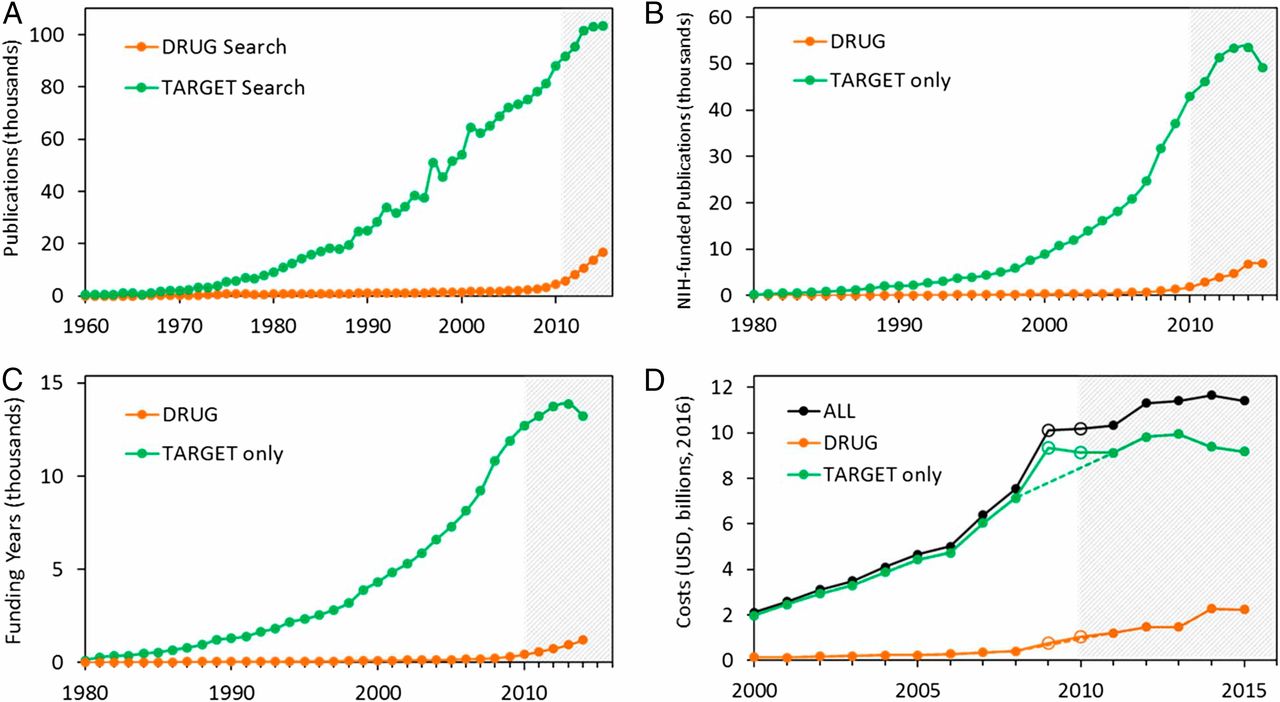 The highest costs are for the antineoplastics as shown here. "The insights and intellectual property arising from this basic research are then transferred to the private sector for development." 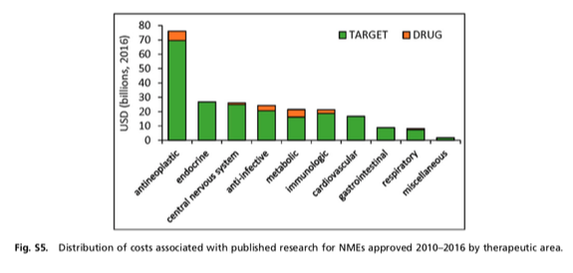 Here is where the pricing and access to potentially life saving drugs becomes interesting--at least from an economics perspective. If you think of medicines as a public good we would further classify them as non-rivalrous (when one person uses the public good, another can also use it) and non-excludable (costly or impossible to exclude someone from using the good). We made health insurance a common good in 1965--think Medicare. If we had adopted the pricing mechanism attributed to Canadian Medicare at that time--It would be the equivalent of 30 trillion dollars in the pockets of US citizens. Now that would have been a more equitable future.  
Have you ever had a doubt about a step along your educational or professional path? Perhaps you omitted data contradicting a client's objective or narrowed your focus so keenly as to obfuscate contrary positions.
I will go first. There was a time when I assumed my role was to write the words I was hired to write. Nothing to see here folks--If the client had a phase III drug about to be approved, the words should plant a fertile field for the industry client to harvest all the spoils. Well, shortly thereafter I realized what I was sowing was carefully edited manure. You could smell it a mile away but what was an independent medical writer to do? I started noticing the data. I was lucky. Numerous stats courses and an ability to learn a little bit of SQL and Python opened many doors to how the data sausage was made. I decided I needed my own platform. Like-minded professionals can gravitate toward or away. As Seth Godin would infer, This is what I made--It might not be for you... Around this time, I attended my first Lown Conference. John Ioannidis presented and my suspicions were confirmed. All was not well in evidence-based medicine. I wrote about his prescient articles numerous times. What follows is a quick summary of what grabbed my attention from Lown 2018--my 3rd Lown conference.
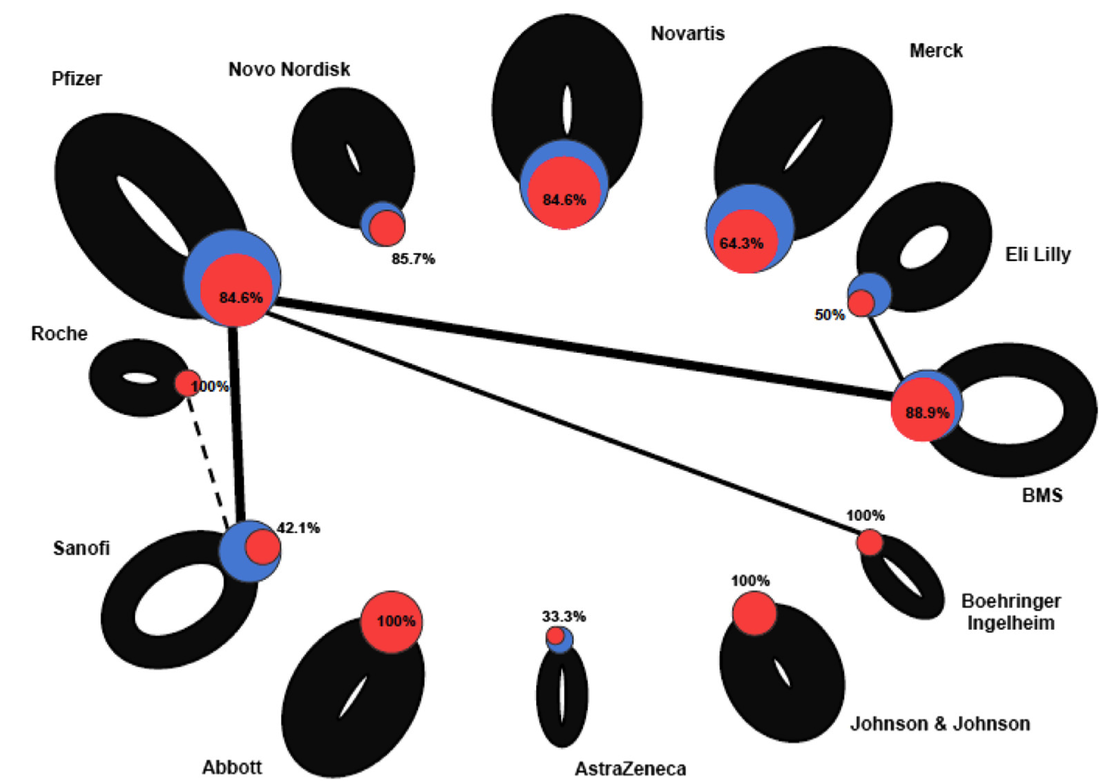
This is the image described in the video. A blue node is a company with the size equivalent to the number of sponsored trials. A link between the node indicates co-sponsored trials. Thin connections or no connections means they didn't test their drug against another drug. The thickness of the line is proportional to companies only investigating its own products or co-sponsored products. The red node indicates favorable results for the clinical trial. This graphic taught me to decipher pharma R&D differently. It isn't about SEC filings--the devil is in the details.
I will be writing more in depth stories about this year's conference. I have a few conversations to distill and a few books to read. First in line is Danielle Martin's Better Now: Six Big Ideas to Improve Health Care for All Canadians. You may recognize Dr Martin from her testimony during senate debate on Affordable Care Act.
Dr. Martin opened the keynote sessions at Lown 2018, How Canada's Successes and Failures Can Inform Our Next System. Canada is single payer Medicare and although it has it's lumps it has lower costs, better outcomes, and does not drive citizens into bankruptcy. She is candid about obvious gaps (no dental, adequate mental health or prescription drug coverage) and reminds us of the cautionary tale of incremental fixes in healthcare.
Powerful discussions from the podium and highlighted in panel sessions emphasize the need for multi-national coalitions to redefine the medical industrial complex for humanity--not profit. A sobering but salient comment, "Prince Edward Island is no match for Pfizer" reminds us that individually--country by country the best efforts will be no match for large power wielding global pharmaceutical companies. Driving what they have branded "innovation" that is in reality, patent protection and share holder investments. In closing, Dr Martin reminded us that Canadian Medicare is narrow but deep--good for what it covers but more is needed. Civic engagement is not about patients but democracy. 
To get a granular look at the current big pharma framework and what a newly minted model might look like I begin with a drawing similar to what I learned here in Business Model Generation: A handbook for visionaries, game changers, and challengers. This is also how I decide what data I am going to need. The upper right quadrant below describes prevention as the main revenue generator with personalized medicine becoming market mainstay--sound familiar?
The colorized image represents the close-up of what that quadrant will look like when we describe key resources and activities, attributes of a competitive value proposition, the role of the customer and their relationships, revenue generation, cost structure re-alignment, and identification of partnerships to maximize drug effectiveness in this new model.
The next few months will be busy working across the lessons learned from the Lancet's series on Canada's global leadership on health. Canada's Universal Health-Care System: Achieving its potential begins the two part series and is a long but worthwhile read. I think I heard correctly that if the US had adopted Canadian prices in the 1960s when US Medicare became law, US workers would have brought home an additional 31 trillion dollars in take home pay to date. I think that is worth investigating.
For perspective on what 1 trillion looks like--think of it as time: How Long Ago Is a Trillion Seconds?If you count backward, then: 1 million seconds = 12 days ago 1 billion seconds = 31 years ago 1 trillion seconds = 30,000 B.C. (give or take a decade or two) I am also waiting for Dr. Vinay Prasad's latest article. If you are active in the healthcare sphere on twitter--you likely know Vinay. It should be published soon and a graphic shared at Lown describing false positives in immune-oncology trials and costs and profits associated with randomized controlled trials will continue to illuminate the lagging results in huge oncology pipelines. 
Dr. Prasad's work has demonstrated that many medical practices, promoted and advocated for decades, are ultimately shown not to work. These reversals typically occur when we adopt new therapies based on incomplete or inadequate studies. Dr. Prasad has also demonstrated that the high cost of cancer drugs is not explained by rational factors, that media coverage of medical articles preferentially covers lower levels of evidence, that industry sponsored randomized trials have substantial bias, and that many current medical practices have no convincing proof of efficacy (e.g. IVC filters).
Follow along here or on twitter or instagram...If any of the words resonate in any way please feel free to buy me a coffee or two. It helps fund the travel and the research.
Thank you again to my sustaining donors! I could not do it without you. |


