
 Symbolism being what it is, can be revealing in ways you might never imagine. I have been listening to Stephen King’s book--On Writing: A Memoir of the Craft. Because you can never pull too many threads without ripping the entire seam it will suffice to say that I have made a pivot to audiobooks for company on long trail runs. I figure at least I won’t have to hear the rabid coyote rip me apart if I bring along a distraction. The bit about the coyote is funnier if you live in my city. There was a coyote on the loose that could not be confirmed or denied as being rabid. It simply attacked a few people on the bike and running trail and either died or became bored. A friend mentioned her pepper spray would save her. She would spray it directly into her own eyes so she didn’t have to watch her demise. Maybe its ultra-runner humor but I still think it’s pretty damn funny.
Stephen King made a reference to “eat your eggs”. In his context (I believe) he was referring to the scene from a Raisin in the Sun where bold dreams and aspirations are being articulated but fall on skeptical--if not deaf ears. Almost like saying, “yada, yada, yada” that is all well and good--now just eat your eggs. Newly minted data professionals are not too different. When I am approached for career advice they often want to know the “how” before even appreciating the “what” or the “why”. I may need to stare at them blankly while reciting, “eat your eggs”. I believe you need to cultivate a passion for your data projects. Admittedly easier to do if your responsibilities aren’t limited to spreadsheets and dull finance reports. For example, Mapping Inequality is a website describing the “redlining” of the 1930s. In 1933, faced with a housing shortage, the federal government began a program explicitly designed to increase — and segregate — America's housing stock. Author Richard Rothstein says the housing programs begun under the New Deal were tantamount to a "state-sponsored system of segregation." In the map below you can see how the neighborhoods were classified in Decatur Illinois in the 1930s. You can select the geographical areas you are interested in exploring. 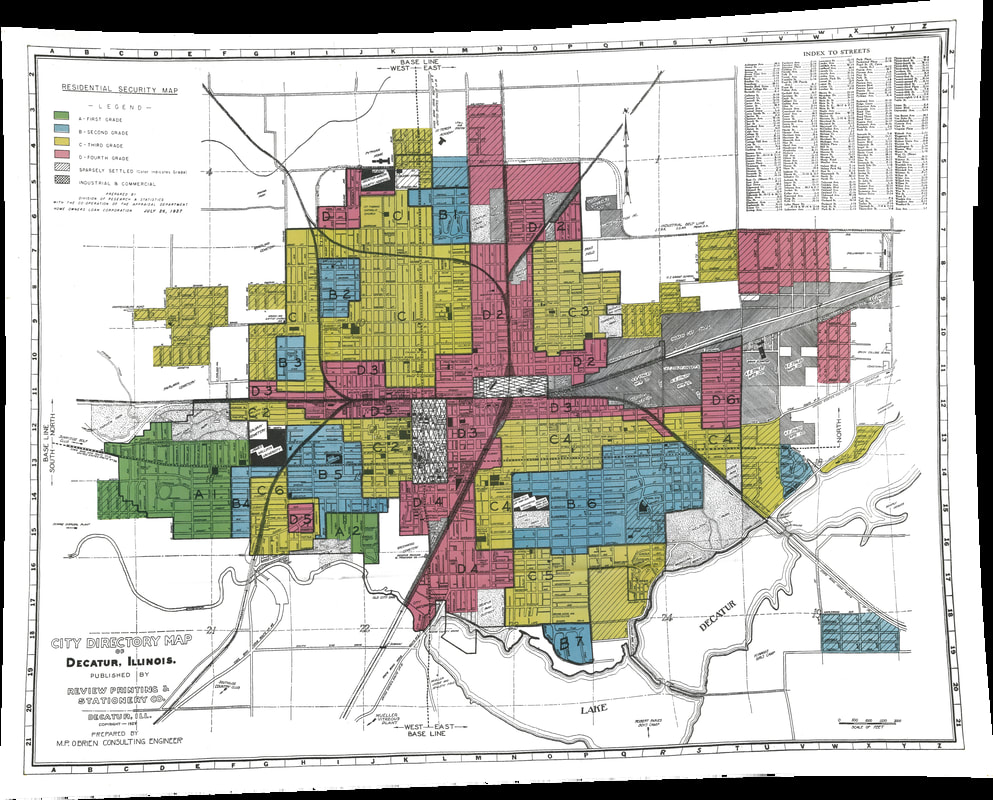 We can see patterns of the districts impacted by segregation in the maps available for inquiry. Census Viewer filtered by census tract and black race demonstrates the population demographics still somewhat predictable in the graphic below. 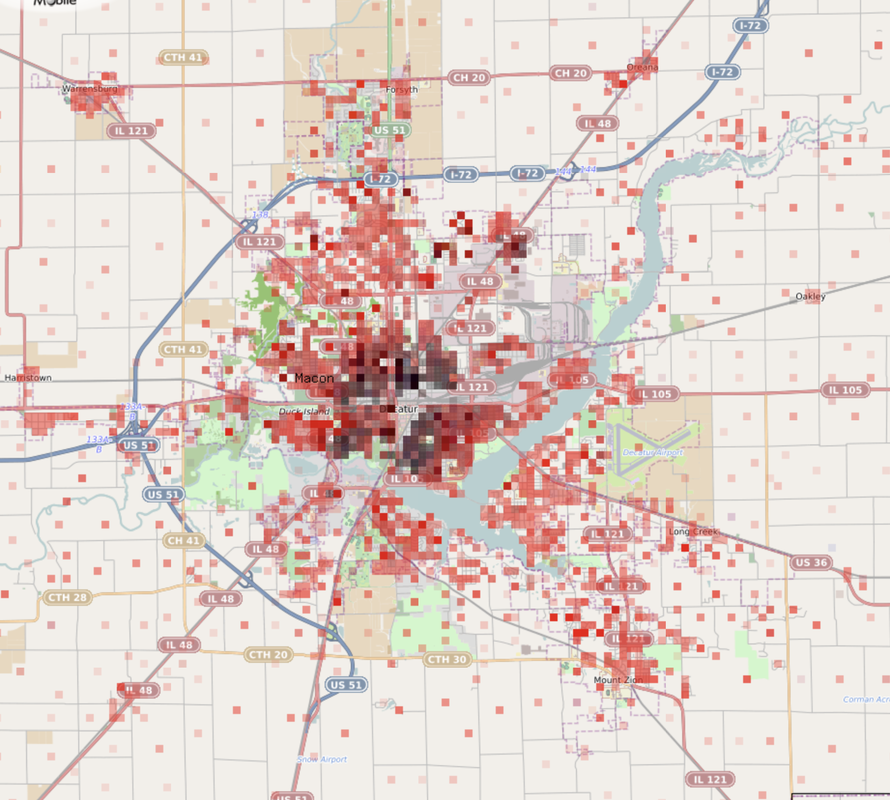 ArcGIS has a native living map depicting urban heat islands. Focusing on the same geographic area we can identify where the zones of heat intensification are within the city. An important thought or additional layer of exploration might be considerations of historically established land-use systems and the modern impact on climate change. Think about neighborhoods with higher square footage of asphalt, low levels of tree line, less green space and you will see higher land surface temperatures and down stream impacts of climate discrimination. 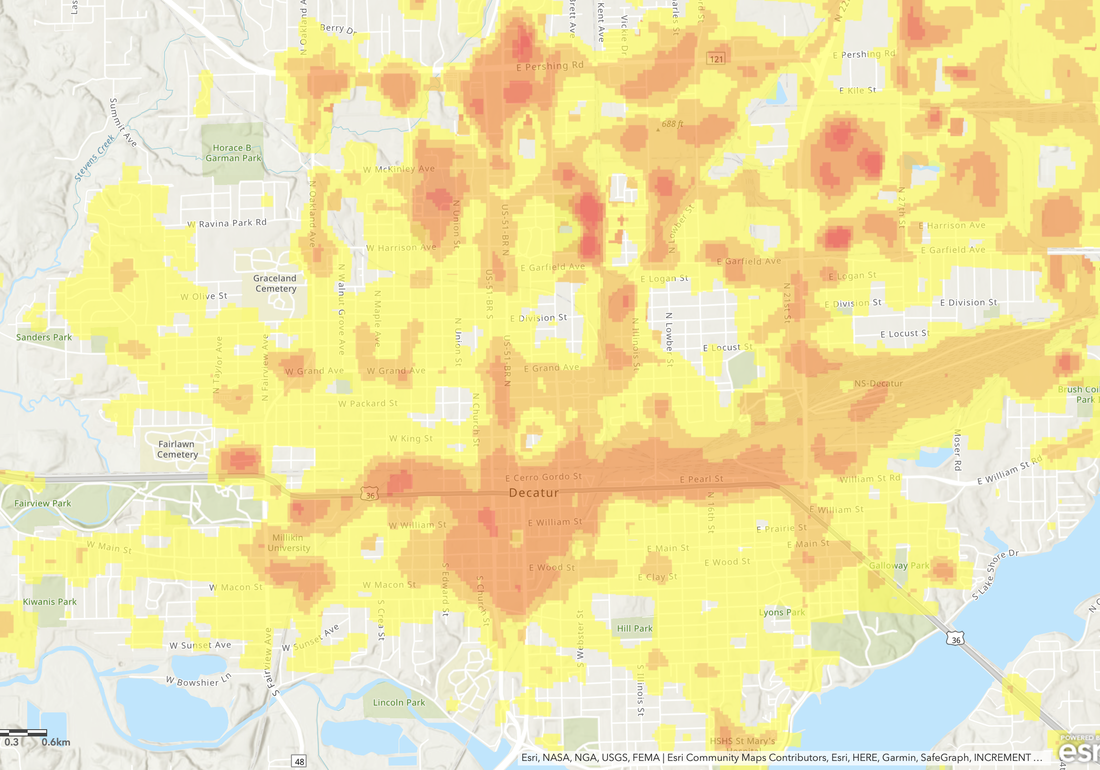 Additionally, most cities capture informative demographic data to enhance perspectives on the distribution of economics at the county, city, or census tract level. Additional questions create hypotheses to identify drivers of poverty density or non-low income diaspora from areas lacking economic investments. 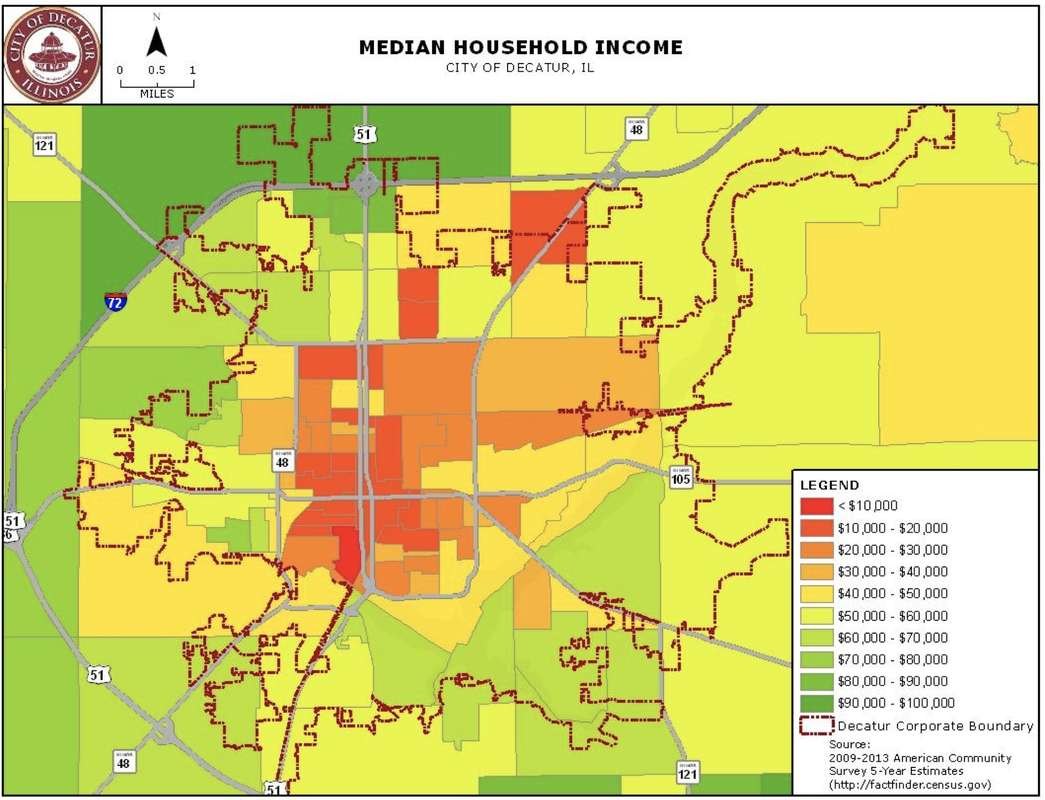 Tom Lisi from the Herald and Review highlights abandoned homes in Decatur cited for potential demolition."The left side shows a "heat map" illustrating pockets of Decatur with the most abandoned homes left to either county officials to manage, or already on the city's demolition list." 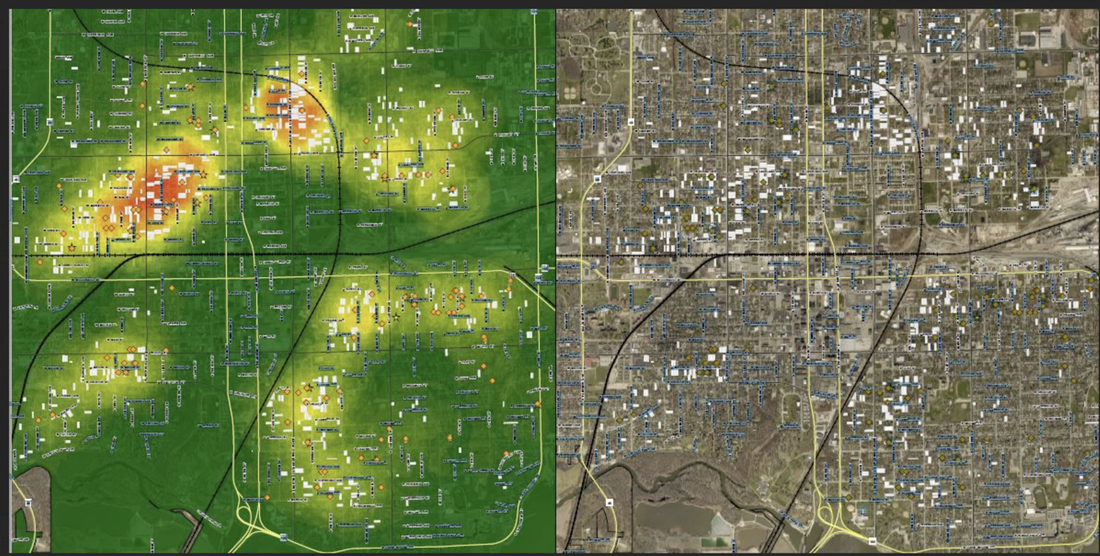 These examples are to show you how important it is to “scramble your eggs” before trying to make a souffle.
You need to build curiosity before you can bring a bit of creativity to your data questions or analyses. Comments are closed.
|