
|
The quote by Glennon Doyle is often repeated in the edited form I borrowed for the title. The full quote, “This life is mine alone...so I have stopped asking people for directions to places they've never been.” Basically I interpret this as a reminder not to compare yourself to others. They haven’t walked your path. It also reminds me of discussing big issues in public health across our communities. If you aren’t including spatial perspectives I think the road is too narrow and perhaps the insights you are curating are distorted. Location intelligence adds an additional layer (pun intended) to data analysis. Herds of data analysts are guilty of mooing the sound “big data” perhaps attempting to direct attention to their own efforts or skills. When I hear the term, I think of data without a story, lacking a formulated question, and most importantly helpless to motivate or change behavior.  When we appreciate the “where” of large datasets we can suddenly reveal deeper insights. We create buckets and filterable data readily available to tell unique curated stories. For example, it appears easy for many to wave away the inevitability of climate change. We can do better. As journalists, data visualizers, analysts, and professionals that use graphics to communicate and share narratives we should focus on data literacy, skill development, and if nothing else--how not to be duped by low value information. How else can you explain the persistence of the spreadsheet? How compelling of a story can you weave with this spreadsheet? 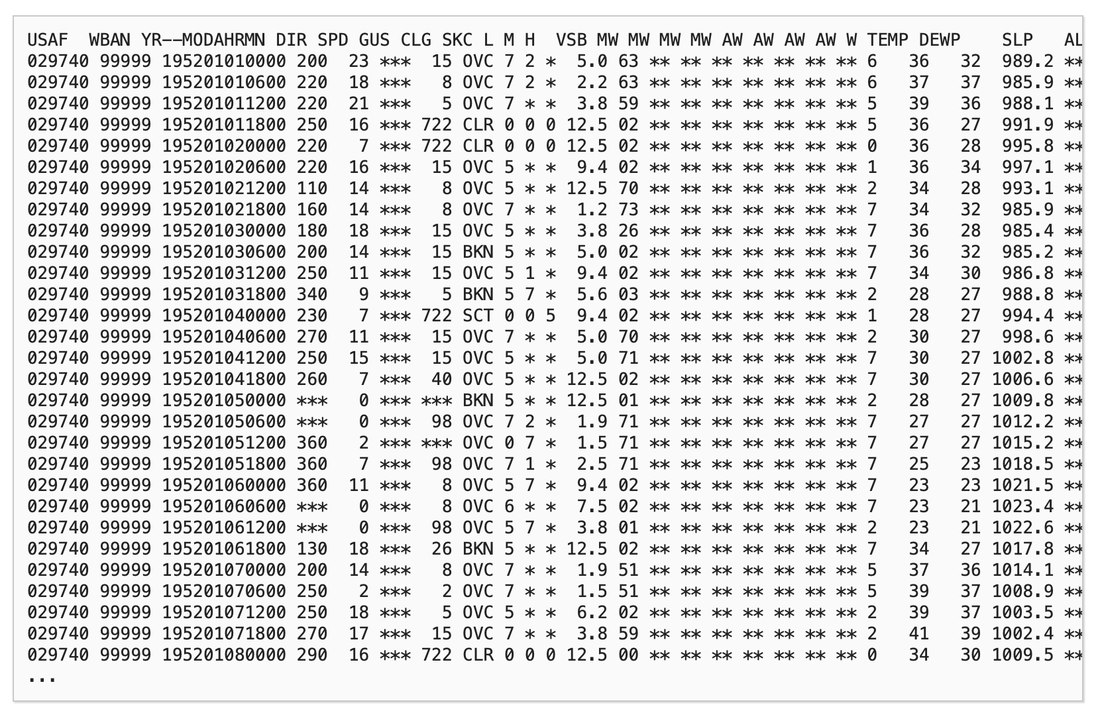 Once we visualize the data we can see trends missing in our initial glance at the spreadsheet. Fluctuations in global temperatures reveal the temporal aspect of climate change but what we can’t see here is the spatial component. 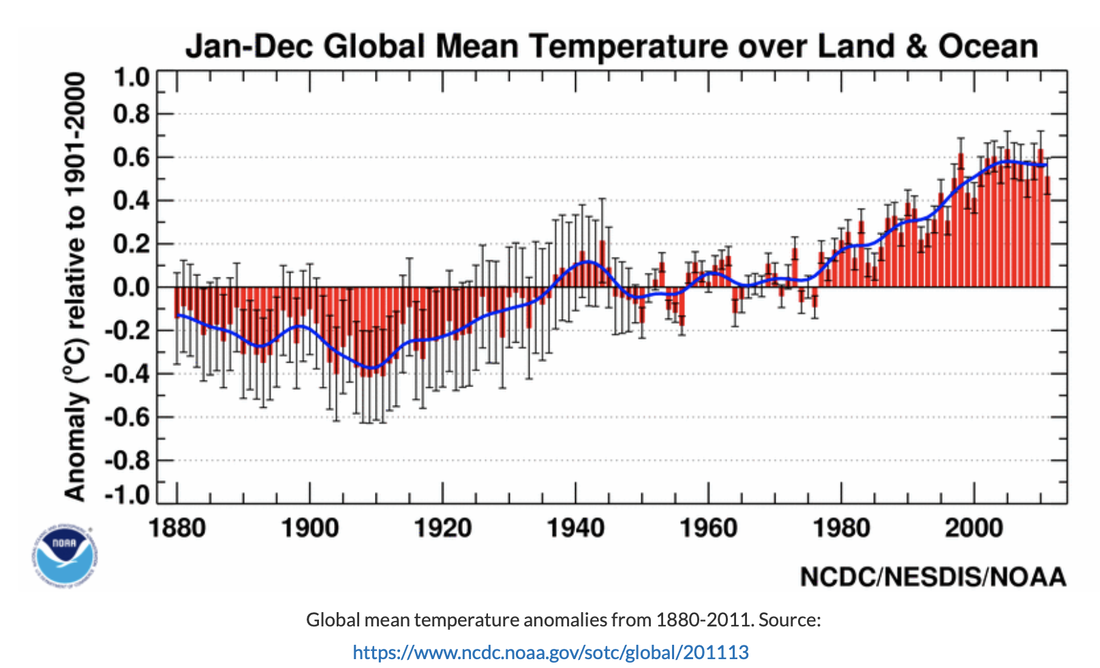 What happens if we sacrifice the temporal aspect for the spatial? This snapshot demonstrates a global perspective but how about getting both integrated into a single visualization. 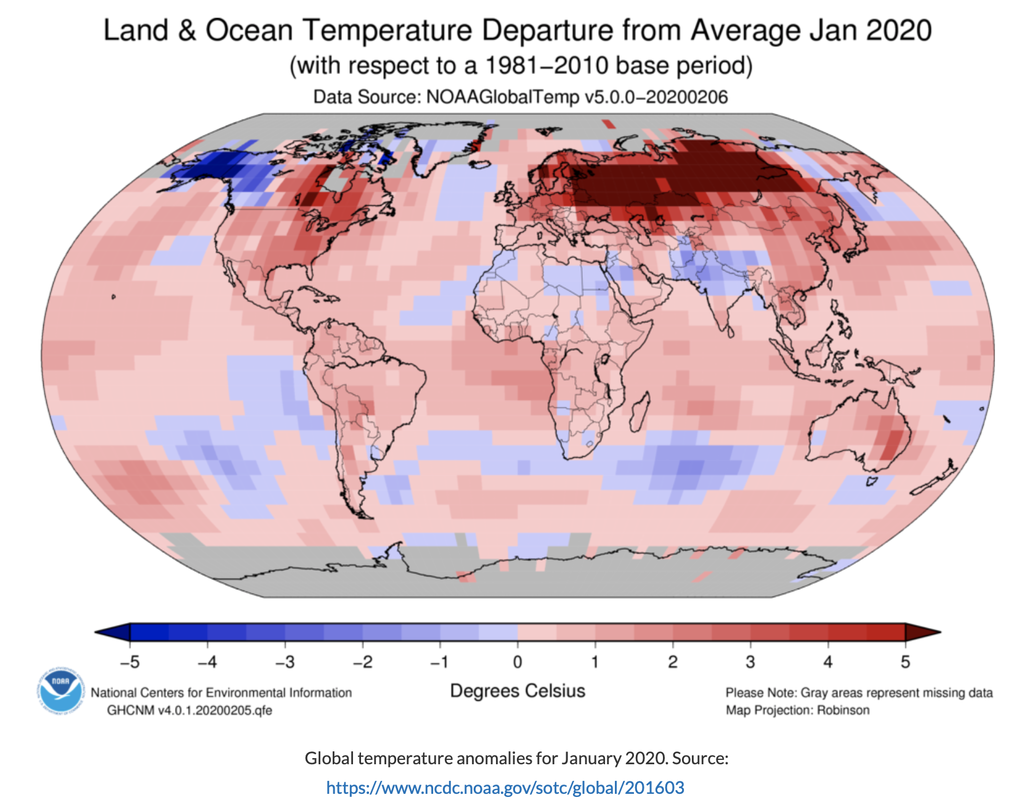 Temperature Anomalies by Country This pill plot does a great job on the global setting to show when anomalies become more routine than exception. Look what happens in the 1970s on a systemic scale. The last graphic reminds me a bit of my recent discussion on Chord Diagrams hosted by Jon Schwabish, One Chart at a Time (below). We can now look at country level (US is at the top) and region level once we watch the temperature change that also included predictions into future decades. I was welcomed to Clubhouse recently and joined a GEOSPATIAL CONNECTIONS community where we discuss climate change and how best to communicate the risks and potential solutions. You can reach out on twitter for an invite. I have a few that I am happy to share with anyone looking to join the community. Creative Commons License I first saw these images in a class that I recommend for the geospatial data curious--GEO-PYTHON 2020  You can follow along on Substack. Subscribers can get step by step “how to” sessions either within the newsletter or pop-up zoom sessions. So far we have talked about geo-python skills, QGIS, Tableau, and even blogging. Comments are closed.
|
