
 "The humblest tasks get beautified if loving hands do them." —Louisa May Alcott I am writing a book on Python for Geospatial Data Analysis. Most of the really cool widgets or packages I discover end up in the book but every now and then--something is cool but not really aligned with the rest of the story. Open route service is free with a robust API that allows you to use navigation information, geocoding, isochrones, points of interest (POIs) and more. I wanted to immortalize the tool so decided you might find it interesting too. Did I mention its free? openrouteserviceI suggest you navigate to the Jupyter Examples and download the binder on GitHub. Or you can just follow along here. I work exclusively on a Mac but it is pretty easy to adapt to whatever your system your preference might be. You need to enter the following into terminal: mkdir ors-apartment conda create -n ors-apartment python=3.6 shapely cd ors-apartment pip install openrouteservice ortools folium You are basically creating an environment called ors-apartment that acts like a container for the necessary packages and dependencies. I used my later version of python and it still worked but if you run into problems you should be able to go as high as 3.7. I am going to assume that you will be working in the notebook so I am simply screen casting my computer images. You will be requesting a key after clicking on the API Playground and entering it in the code below where it says ‘your key’. The task at hand is you have located 3 potential new apartments/homes. Maybe you would like to find certain neighborhood features and you want to see which location has more bang for the buck. 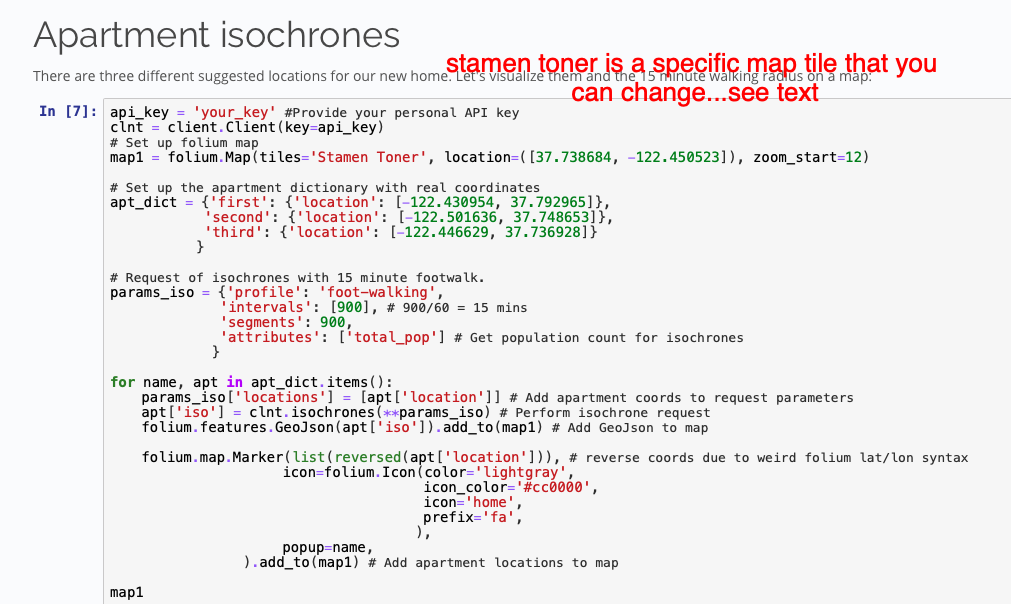 I left the locations the same but here is where you can have some fun with customization. It looks like they list lat/long as long/lat when creating the apt_dict so make sure you make the switch in your code if pulling coordinates from another website. You can also change the map tiles (Stamen)as they are open source tools from OpenStreetMap. 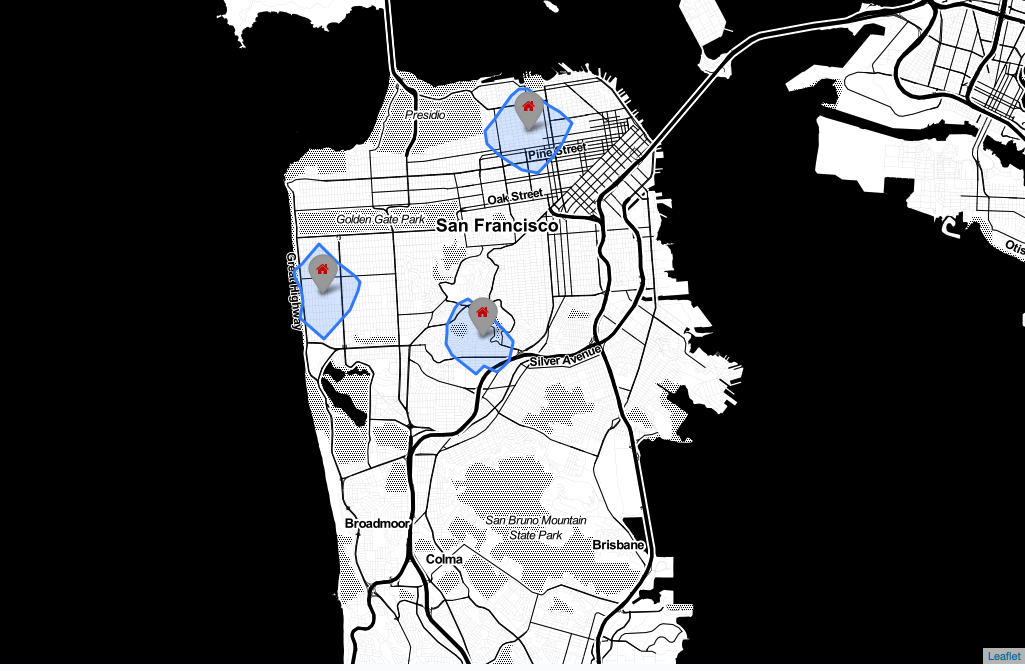 If you are relying on walking distance head over to the link https://github.com/GIScience/openrouteservice-docs to pick the features and the locations from the index--search for Places Response to find the category_ids. I selected museums, supermarket, and dog-park. The code as written in git-hub will throw an error if you don’t add the [0] between clnt.places and features (see below). 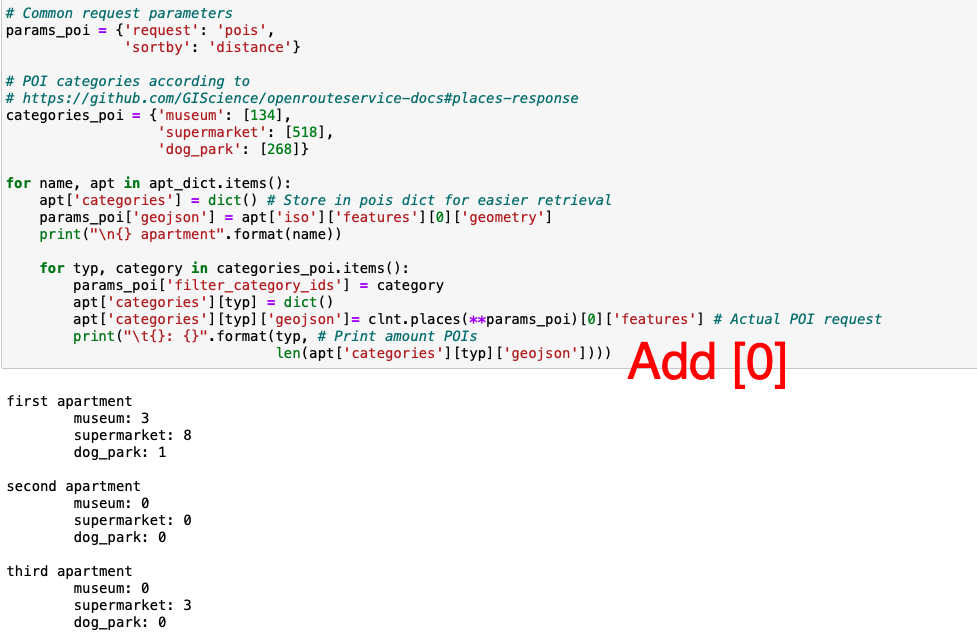 Once you run the code you can see one of the locations is completely out of the running. None of the attributes you were seeking are within your radius. The syntax for the code can be reviewed in the Folium documentation. The style_dict includes icons to identify the requested items you would like to see in your chosen neighborhood. I simply selected free font-awesome icons that would identify the locations. If you render your map and the tags are blank you either picked or dud or a paid service so keep looking.  The map that renders below shows the neighborhood with the most of what you wanted to see near your new home. 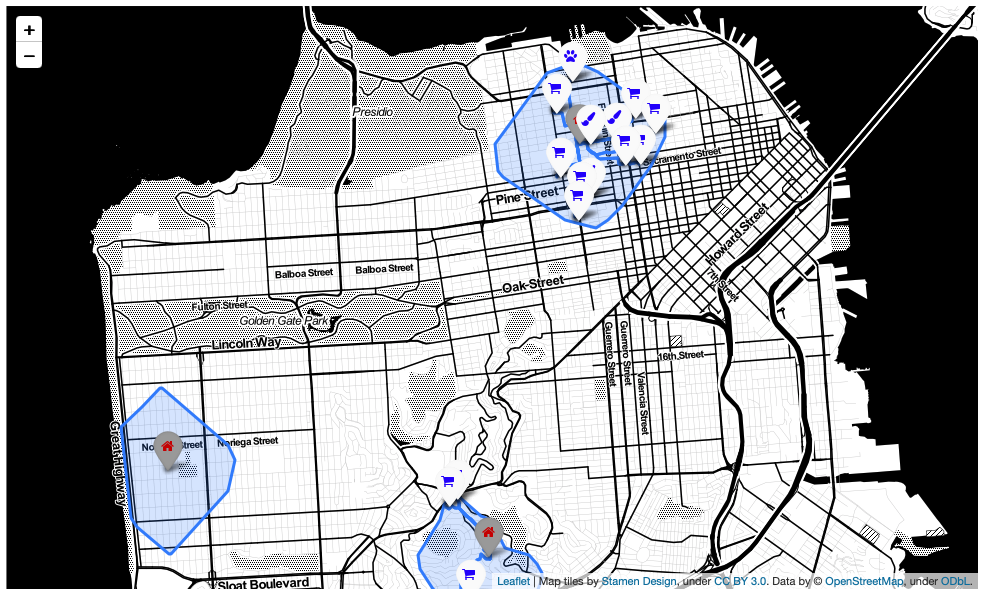 If the search had shown tighter results between the properties you could compare the distances and pick a winner. For the data I selected the zero values were problematic and only yielded distance for apartment 1. 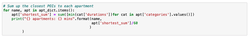 There is one more cool thing below. You can design your own atlas and bring it into the field with you. Click the link to find out how. One more really cool thing...make your own atlas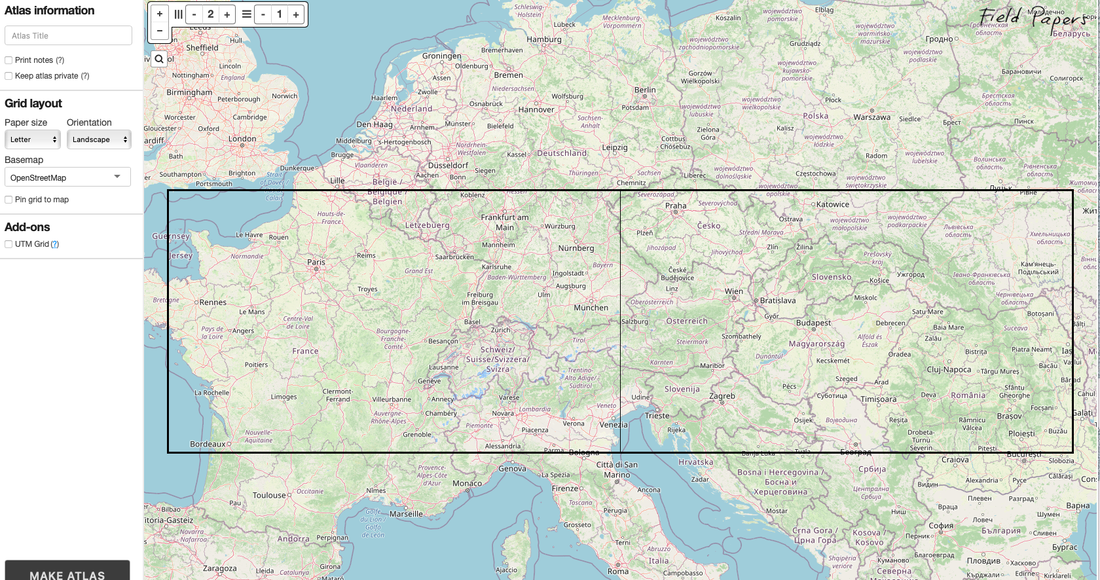 Comments are closed.
|
