The free sharing and teaching of open source is incompatible with the notion of the solitary genius 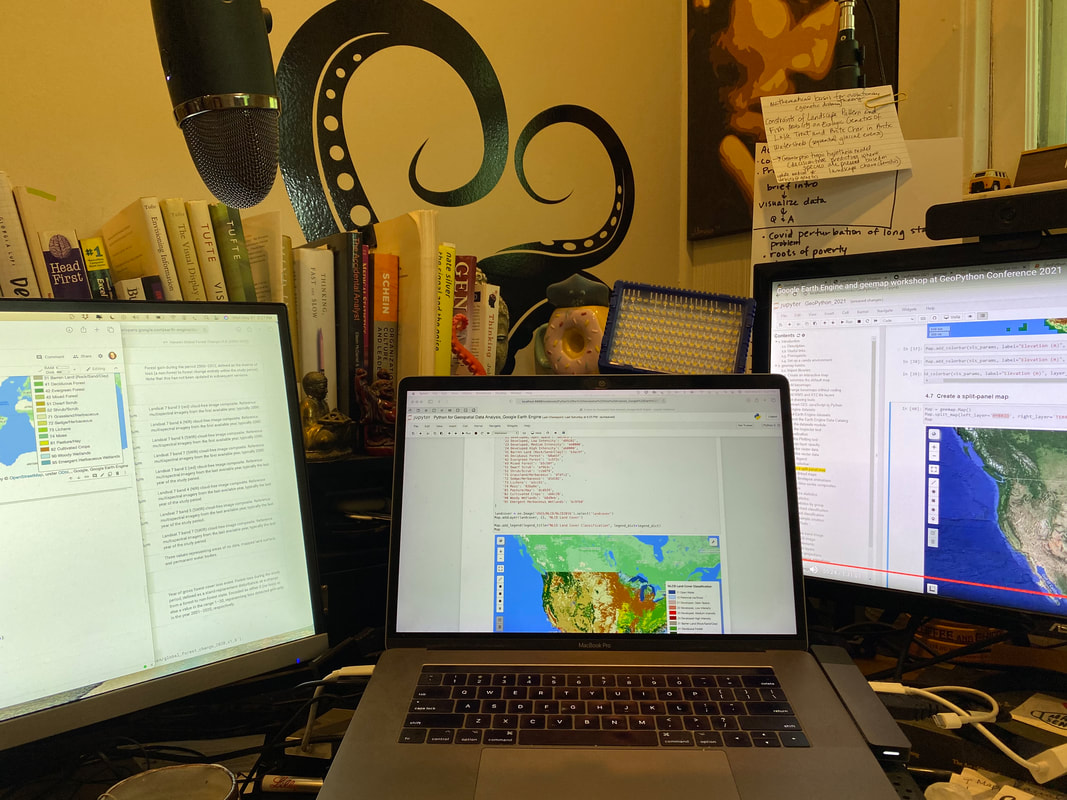
Are you on Clubhouse? I joke that someone left a door open in the hallway and I wandered in. I like the breaks from the computer screen where you can simply engage through your phone. Think of it like a podcast style conversation. Data + AI hosts a room, Data Geek Weekly. This past room was right up my alley.
The panel discussed social (structural) determinants of health with Michael Petersen, MD. I am not sure if it was Michael or Jeff that differentiated me from Bonnie Holub by calling me geospatial Bonny but it made me laugh all day. In the course of an open discussion I mentioned a few data resources that I wanted to share with folks in the room.
Here are the resources I mentioned. They might seem random but I think they were some of the tabs I had open at the moment so here you are...
Google Earth Engine
There is a location for everything so I have to start with Google Earth Engine (GEE) in case there are other interested in location intelligence. Click the button below and watch the glacier retreat. We were talking about climate change and urban heat islands (below) but it can be powerful to start with an upstream view.
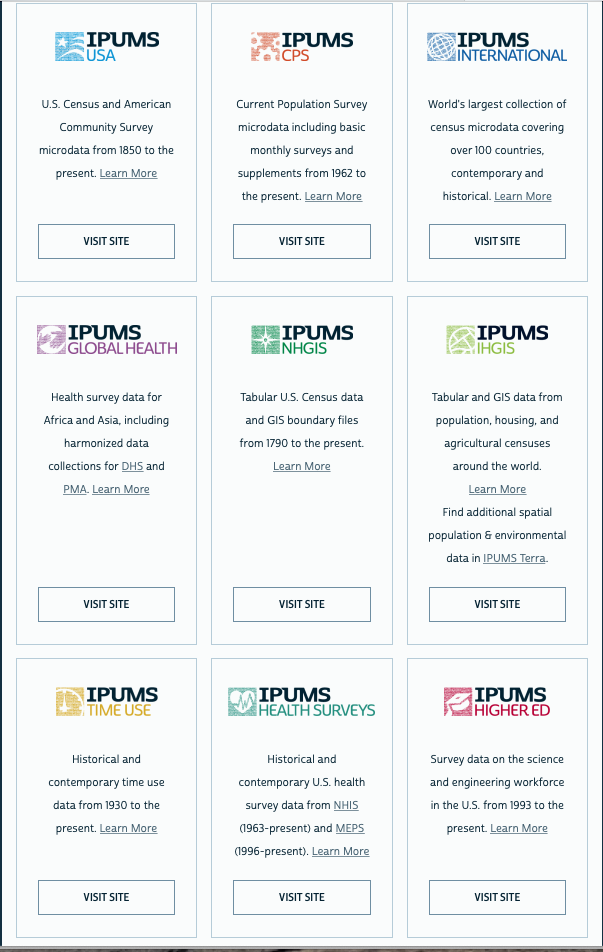
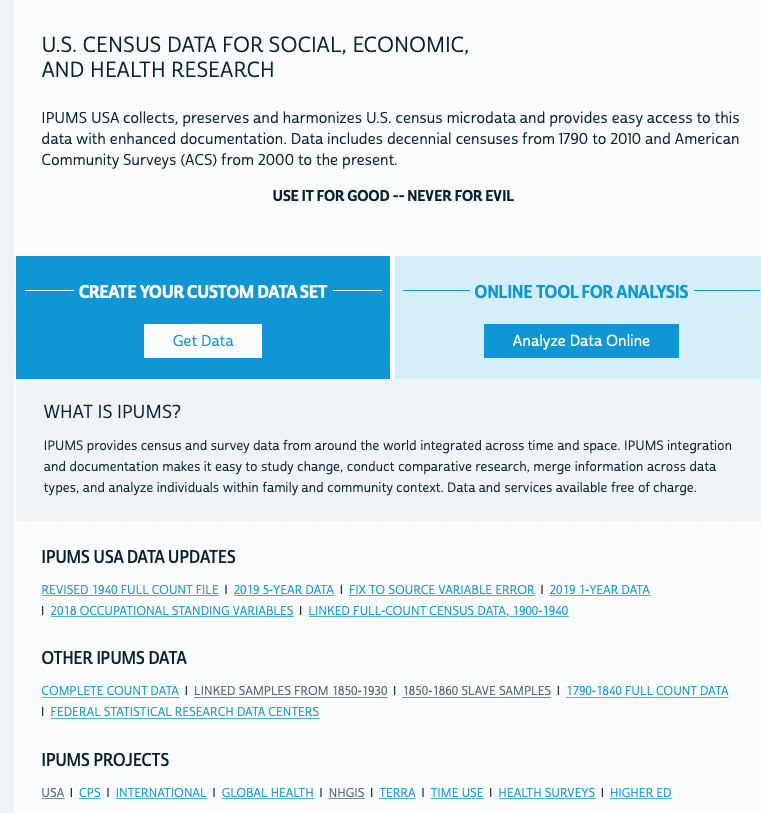
IPUMS (CENSUS data and more)
I mentioned a heavy reliance on CENSUS data. I use American Community Survey for yearly comparisons as well as the PULSE Covid surveys. IPUMS is a great resource for a lot of the work I do because of the harmonization and detailed documentation.
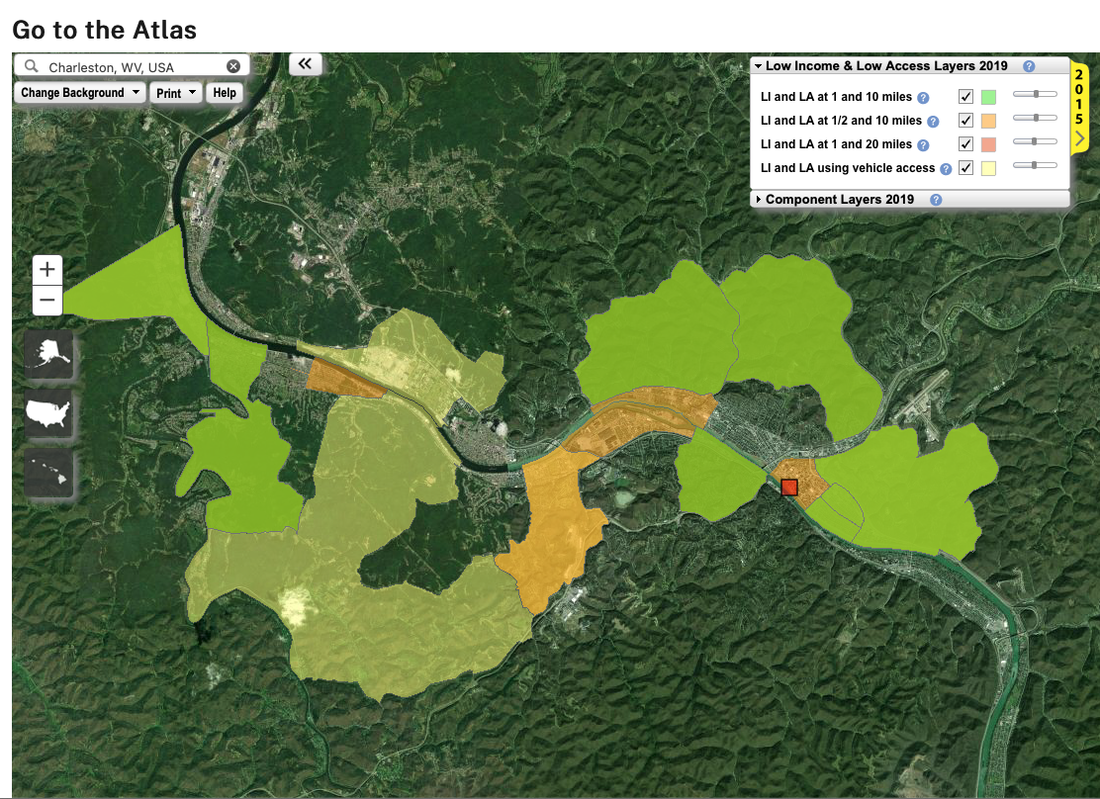
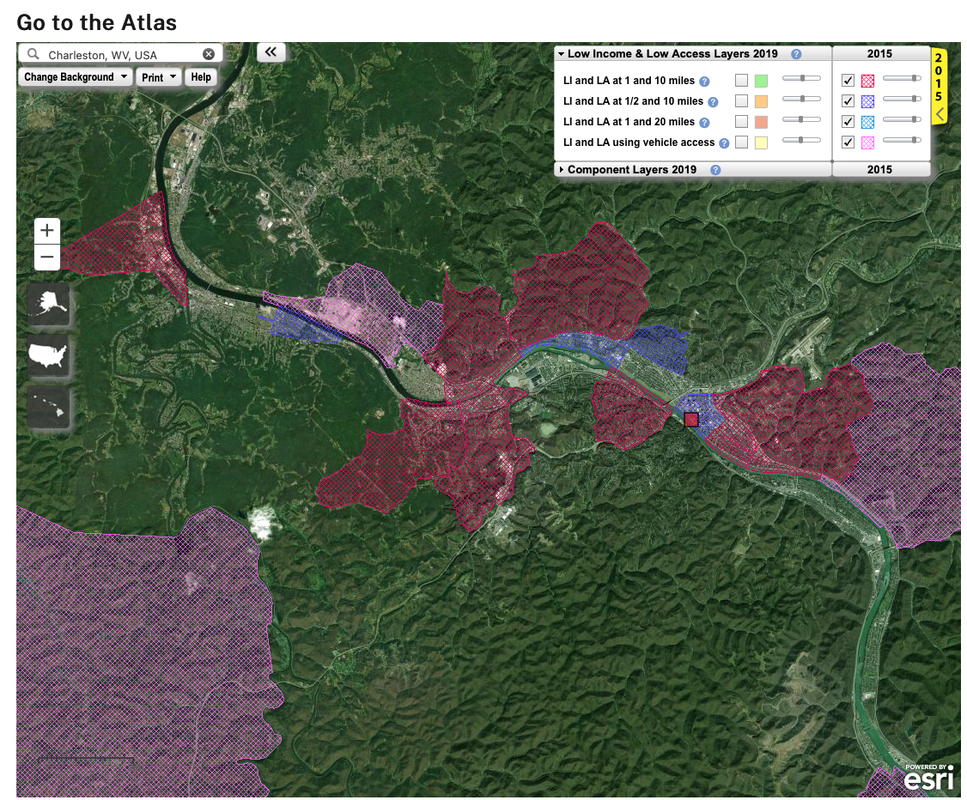
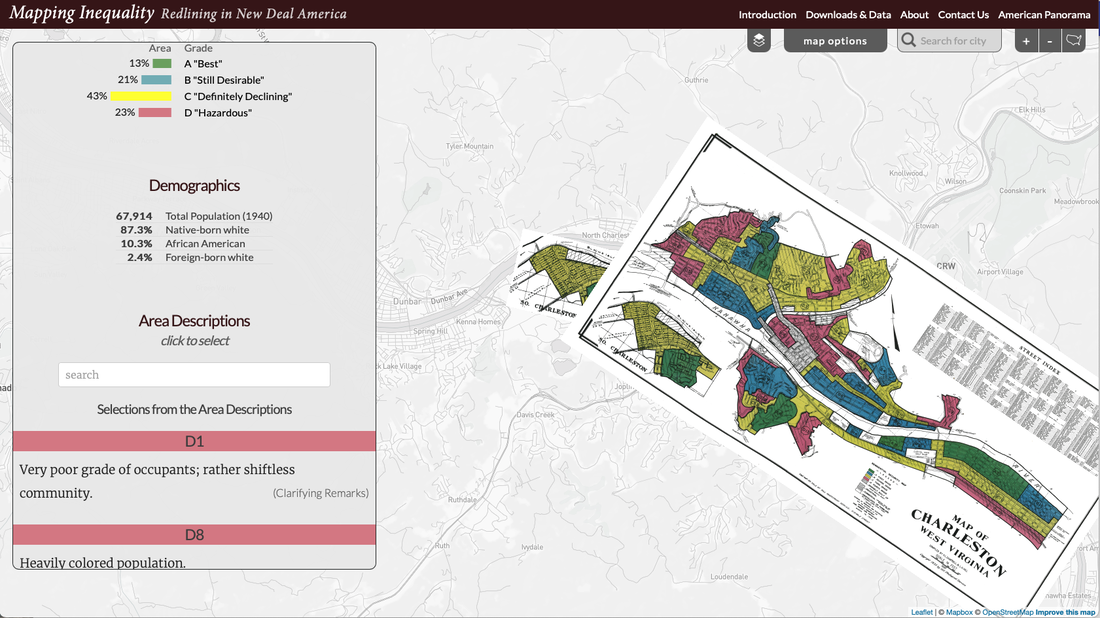
Mapping Inequality
The better your data question the more exploration you will need to curate insights and better yet to curate empathy. We need to be open to aligning edges outside of what we view as our penumbra of expertise.
,I tend to use open source or freely available platforms and tools for analyses. I imagine how frustrating it would be to take a weekend workshop only to find out about a hefty price tag for you to continue your data exploration. I use QGIS (open source) but also rely on ArcGIS for quick maps. An ArcGIS personal 1-year subscription is $100 and well worth the investment.
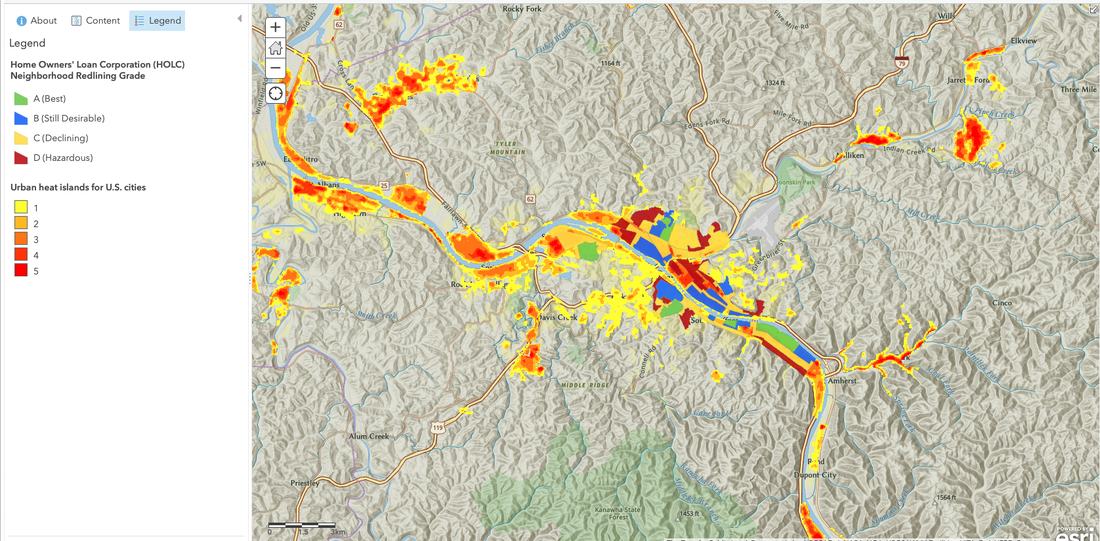
This is an example of an urban heat island. I chose Charleston, West Virginia to highlight patterns not often visualized outside the typical locations such as Chicago or NYC. 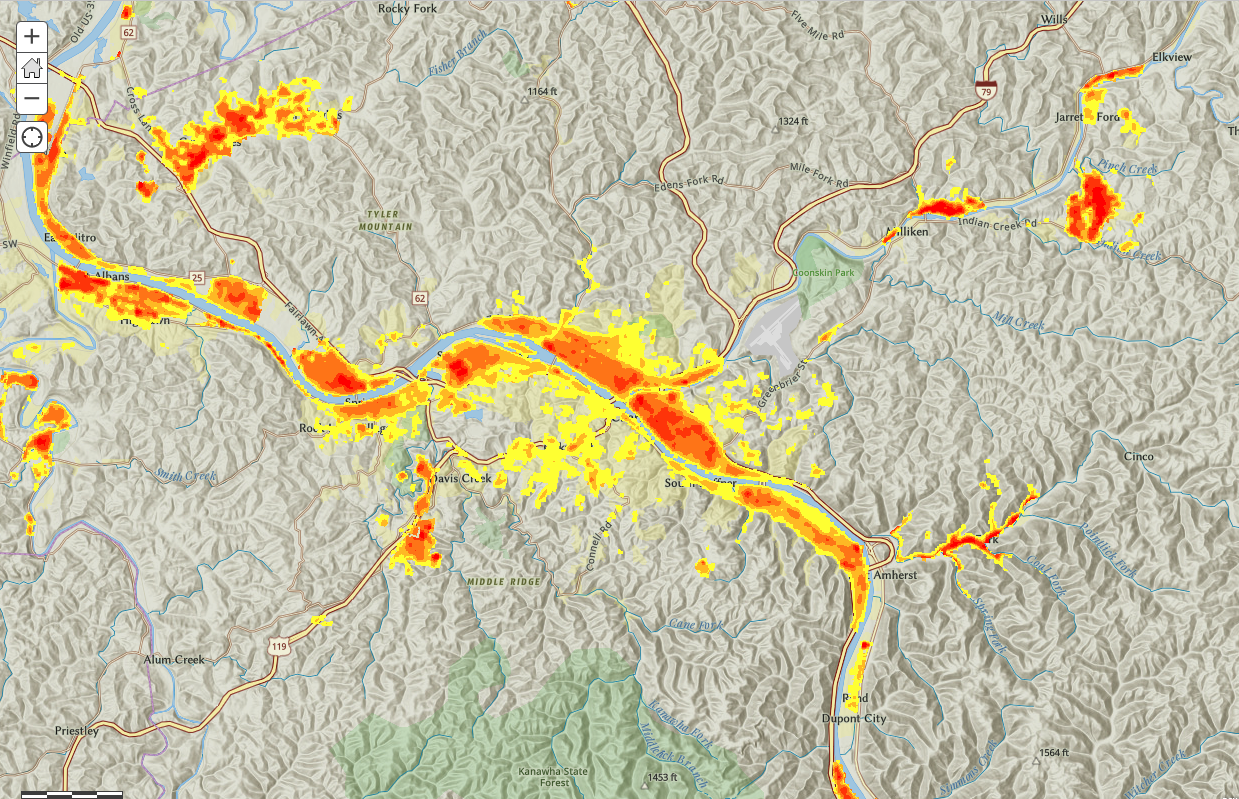
I layered the Home Owners’ Loan Corporation (HOLC) neighborhood guides for you to explore. I briefly mentioned how land-use systems were locked in decades ago and continue to impact the temperature differentials in urban environments--and therefore health outcomes.
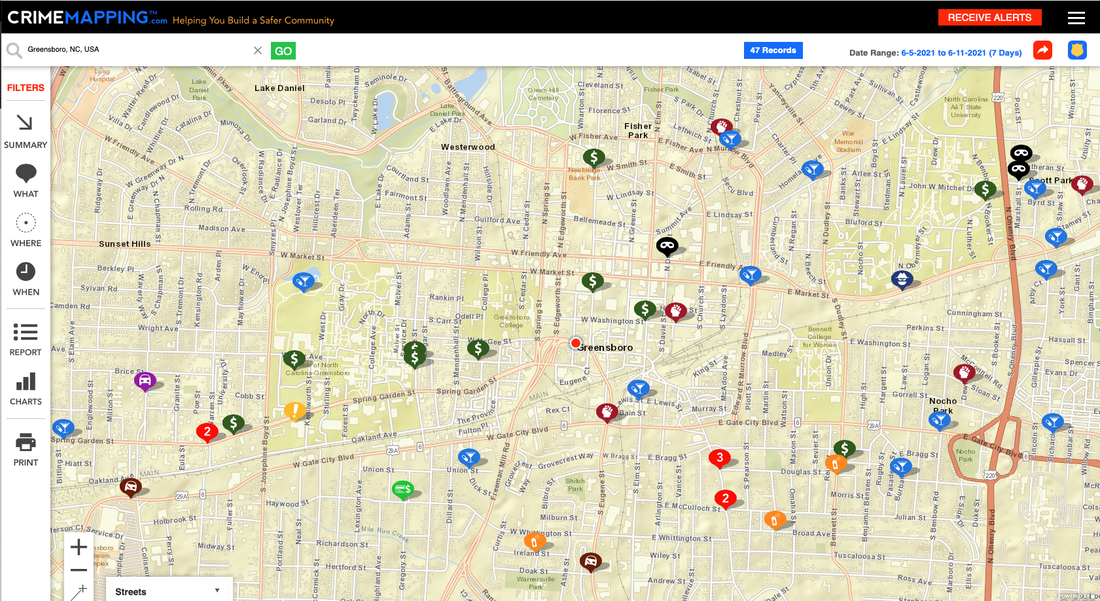
There is an abundance of federal, state, and community level crime data. One take-home message I will share is that data is collected differently and may not be able to be aggregated. For example, recent work in gun violence demonstrated that many districts were not reporting the data until the crimes were solved. I also realized that unless I requested data on the perpetrator most of the data was only about the victim. I was interested in the demographics of both.
The Crimemapping data below is from my city. The data is only available if your city subscribes to the service but as you can see, the types of crimes in your area are displayed. Crime data
|
Sign up for our newsletter!
Browse the archive...

Thank you for making a donution!
|