
|
Back in the days of too many conference invitations to accept I would often walk the conference hotel entering into unstructured but important conversations with policy makers, distinguished keynotes and leaders in their field and I always had a similar feeling. The people that need to hear this are not in our audience. Health insurance executives were not talking to the healthcare provider making decisions at the point of care, policy makers used terms like “we” and “us” to a room full of “them”, and often large parts of the discussion were muted. Without complete outreach to solve seemingly intractable problems we are either grasping at low hanging fruit, preaching to the choir, or intentionally poking out our own eye. It was moments like these that moved me to work in healthcare data literacy and to start this blog over 5 or 6 years ago. Yes, from time to time you might have to use a new tool to be able to access large datasets but more important than the latest "Tableau How To" video--is a workflow of how to ask better questions. There is such complexity in how government, government policy, health economics, and clinical medicine intersect I found that with my press credentials I had access to conversations not openly available to my colleagues. A vital part of my understanding of the complexity of health law and policy is derived from The Week in Health Law--an important podcast always but perhaps even more so in the current era. A recent report Assessing Legal Responses to COVID-19 has been published by the George Consortium and is discussed and available for download. I attempted to discuss insights with a few colleagues but was disappointed that not many were even aware of its existence. This collection of 36 expert assessments shows that the COVID-19 failure is, in important ways, also a legal failure: I have challenged well-meaning data visualizations attempting to provide clarity and information by providing access to data and access to a smart software platform. My fear was and is that we are missing the contextual arguments that provide relevance and meaning to our analytics. I think this report is a good place to begin. Assessing Legal Responses to COVID-19--link to full report
How reliable is the data? Why isn't the US Centers for Disease Control and Prevention (CDC) an independent agency? You know, like the authors suggest, akin to the Federal Reserve? Politics shouldn’t influence data collection and statistical rigor during a pandemic--think back to AIDS research during the AIDs crisis and to current COVID-19 or research into firearm prevention and deaths... As Patricia Williams points out in her powerful closing reflections on this Report, these disparities do not arise from bad individual choices or biological differences between races but the social factors that shape people’s lives every day “in the ghettoized geographies that have become such petri dishes of contagion.” These disparities are not inevitable. We as a society have created them. Centuries of oppression through policies, norms, and institutional practices shape individual experience and over time have created the inequitable society we inhabit. This report contains over 220 pages arranged into 35 chapters across multiple domains relevant to the discussions around race and equity during the COVID crisis. My hope is that you will read every word but here is a quick synopsis of what I reviewed before listening to a panel discussion Coronavirus Conversations: Racial Bias in the Healthcare System & COVID Outcomes presented by Duke Science and Society. 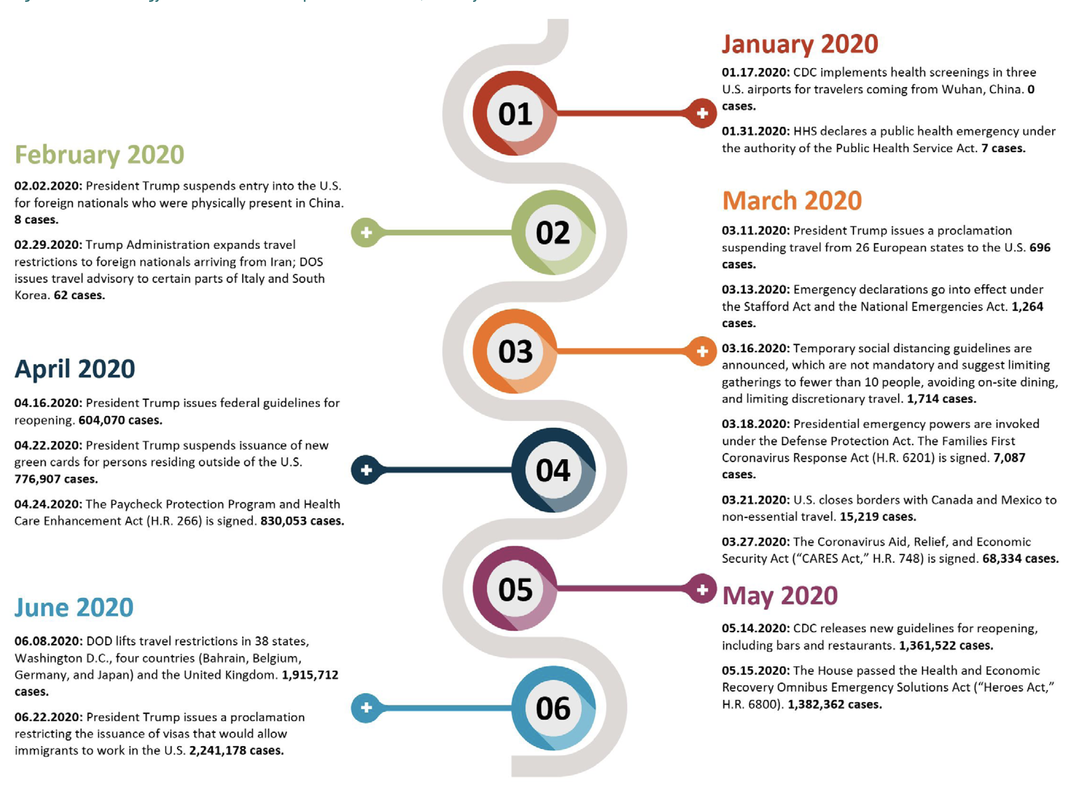 One thing I note from my experience either participating in or observing these discussions is our keen focus on the symptoms of racial disparities in health instead of the structural elements that allow them to continue. Our nation rarely gives voice to our 400 year (and counting) origin story which I would argue may not just be part of the problem--but the whole problem. The report dares to state unequivocally--here is the cause, the remedy, and implementation steps to address these gaps in equity painfully revealed during this latest pandemic. 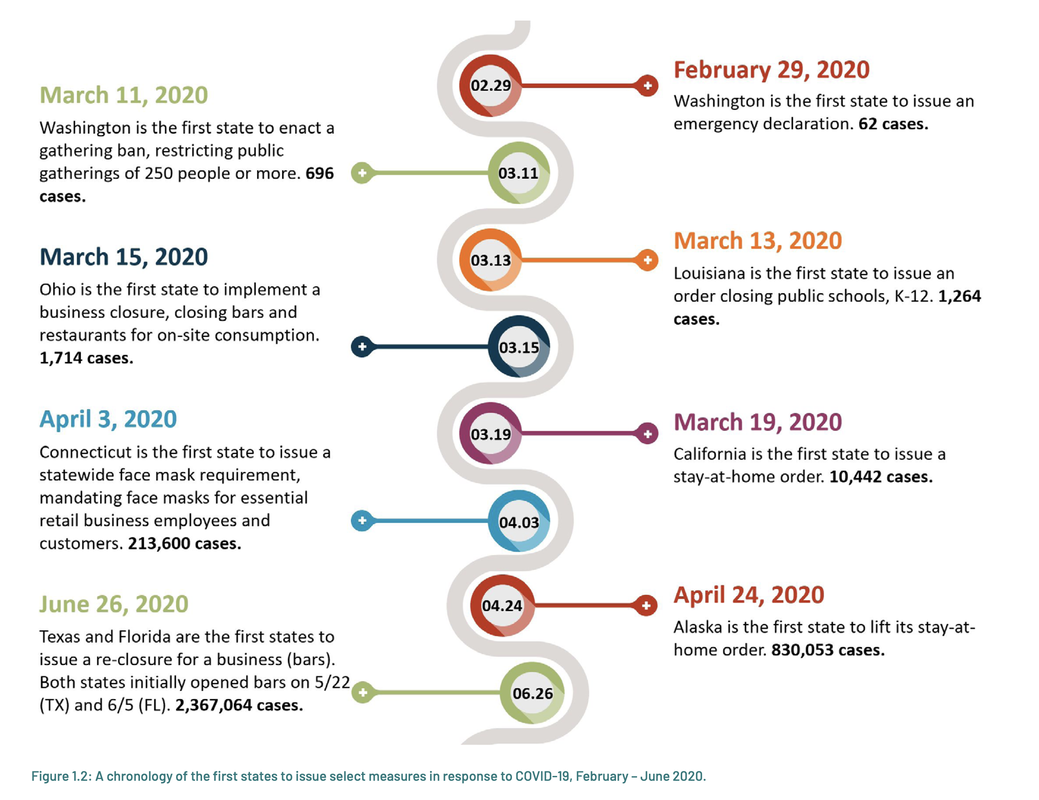 Congress should also amend the Public Health Services Act to add transparency and accountability mechanisms that require the U.S. Health and Human Services Secretary and CDC Director to provide scientific support for guidance and orders responding to the pandemic. In the face of executive failure or deliberate suppression of information, it is urgent for Congress to mandate and fund efforts to assure the collection and dissemination of accurate data. Disease surveillance reports should require enhanced demographic data collection that includes sexual orientation, gender identity, and disability status. I have taught several data workshops to bring tools like ArcGIS, Tableau, and simple coding to journalists and professionals attempting to either gather or access timely datasets. But here is the problem. Much of what we would need to illuminate and share data insights--isn’t being collected. Or even if it is collected--in the absence of harmonization or consensus on variables--how clear are the insights we can gather? In particular, because most states have constitutional limitations on deficit spending, only the federal government can supply the resources needed to ensure adequate testing and personal protective equipment (PPE), and research in and distribution of countermeasures. Likewise, only the federal government can soften the pandemic’s economic impact and prevent it from exacerbating pre-existing inequities. The federal government needs to take more steps in each of these areas. A recent COVID-19 dataset had captured “recovered”. Already confused by muddy definitions of “confirmed” cases I explored how determination was made in marking cases as recovered. What I was able to gather was crudely, a patient confirmed with covid but also non-dead. The graphic below is surprisingly useful at noticing adoption of mitigation measures in the absence of a national response. I will leave you to make your own conclusions. 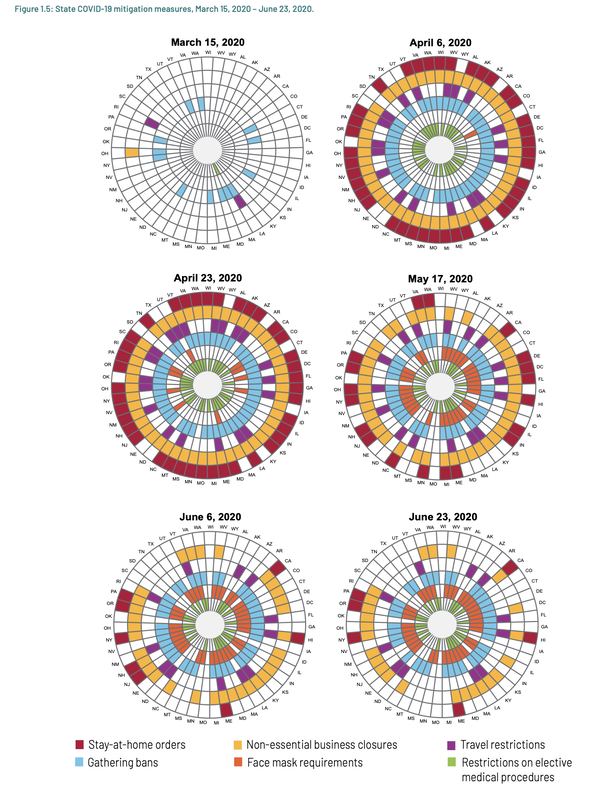 “We can divide ourselves up into races and castes and neighborhoods and nations all we like, but to the virus-if not, alas, to us-we are one glorious, shimmering, and singular species.”--Patricia Williams, JD
Introducing datalchemy...
So far, reviews are favorable. The net is intentionally wide for you to gain the most amount of information in the shortest time. Additional classes are being built around specific topics so if you want that deeper dive--there you go. My objective is not to trick you into learning how to code in Python. I might share useful code tidbits here and there for quick free alternatives to software that might require an investment. As I discover new tools and platforms like Loom, Descript, or ArcGIS they will be in the background in courses I build using them but if you want to learn how to use them--I will have your back. Two more things: 1. I built a new lesson into an existing course when a student had a specific need. The courses will be fluid and responsive like that--the platforms are all new to me too. If you don’t see it, ask for it. 2. Here is the big finish. I built these courses because skill development is one thing. What to do with the skill once you return to your desk is quite another. Maybe it was just me but all of the accolades in a Columbia School of Engineering Executive Online course in Applied Analytics wasn’t much help when I needed a work flow to create a sentiment analysis. I had a bunch of Python training but not much around the application side. Same thing with data visualization software or analyzing giant datasets--where to start. Well, I humbly suggest you start here. True genius resides in the capacity for evaluation of uncertain, hazardous, and conflicting information--Winston Churchill   Are stupid people smug? Is your "excessive pride" allowed to stand in the shadow of an uninformed perspective? My son says I am manipulative. "Yes, mom you are manipulative. Everyone knows it. Dad knows it. Your friends know it." How do I capture this little gem of a tirade and insert it next to the "nature" photos and forced home-cooked meals on social media. "Hey, I ran this morning. Over 8 miles and I saw a large turtle and a beautiful Heron." Take a look here! I know how to catalog my singular experiences but the noise that interrupts what I want to do and what I seemingly am expected to do by others often gets left on the cutting room floor. Aren't all parents manipulative? You get the vegetables into their digestive tracks by hiding them in smoothies and soups. You introduce social discourse and intellectual curiosity to seed compassion and knowledge. You certainly can't leave a stack of Noam Chomsky books scattered throughout your home and anticipate them falling in love with a leading liberal intellectual by chance--can you? But you can lead by example. Demonstrate the ability to hold a tension while you read the literature or research the topic. Well yes, originally Dr. Fauci did not encourage us to make a run on surgical masks to protect against Covid-19. We did not have data and the concern was he did not want them diverted from the healthcare professionals that required them. See? I can speak a truth without throwing the expert out of the window with the proverbial bathwater. A young woman walked towards me in the hall outside of LabCorp in my town. No mask, no hubris--almost no pants. As she approached I mentioned that she would need a mask to enter the waiting area. "What, I need a mask?" she whined. I was in the hall informing my son by phone that yes he indeed had an appointment for the Covid-19 antibody test but he did not as of yet, have the order for the test. "I don't see it mom. There is nothing on this page" he accused in a manner only available to 18 year olds. "Keep looking. It is there. Good lord I need to get this woman away from me. I will be right back. Text me if you can't find it." He ear-witnessed me "manipulating" a young adult into heading back down the hall to procure a mask. Of course, she coughed and made no attempt to cover her mouth or appreciate the irony of her actions. I rely on the Covid-19 antibody test to periodically assess any potential exposure. We are going to visit my 82 year old mother and even with masks and social distancing I like a little data on my side. So after a few weeks of begrudgingly writing a clinical manuscript I am heading north for a quick visit to help my mom with a few things. Things that could be done by phone if I was more patient. But I am not. Or more manipulative--which apparently comes and goes. Full disclosure. I am a recovering medical writer. I cast away the 6 figure income in exchange for becoming reacquainted with my soul but the abrupt financial impact of Covid-19 left me vulnerable and needing to replace reduced income. If you make your money speaking and flying around the country you are definitely picking up what I am putting down. I did it for the money. I am not a stupid person. Maybe even smug at times when it comes to medical writing--but I hate it. It makes me hate writing. The deadlines and stupid comments like "let's try this word instead of this one" and "don't show this in the graphic, just mention it briefly in the discussion" numbs my brain like too cold ice-cream. But I could pay my mortgage for almost 6 months with this gigantic pay out. Good-bye soul. See you in a few months. Are we all doing weird things to get by in these uncertain times? I don't want to complain or whine because we are all so fortunate in comparison to so many. I tell my kids all the time, "No whining on the yacht!" There seems to be no end in sight. I think David Sedaris has it right. There are 2 choices. You can either pay someone to listen to your problems or write about your problems and let people pay you. Well, who is smug now? "An ancient Japanese legend promises that anyone who folds a thousand origami cranes will be granted a wish by the gods."--Wikipedia
  The title and quote are from Henry Rollins. He does not suffer the fools and engages in conversations we all need to hear. He once told a story about sitting on the beach eating a day-old sandwich he nicked from the green room at an Ozzie Osborne concert. Sadly I don't remember the rest of the story because it was years and years ago from his column in the LA Times but that detail you might not think was relevant to the story has had me paying attention to his perspective ever since. Today as an Applied Data Analyst it is always about the details. I am quietly sipping coffee before redirecting my focus. Being grounded from traveling for about a bazillion weeks is starting to change me on a cellular level. I am seeking something new. In fact, I agreed to help launch a Tableau User Group in India (remotely). And I am presenting at SciPy during the Diversity Luncheon. The biggest change is that I have agreed to write a few manuscripts. I often introduce myself as a recovering medical writer and here is why. I don't want to be a shill for the pharmaceutical industry, continuing medical education, or anyone that tells you what you need to write, how to say it, what to measure, and which lines not to cross. Several years ago I became a full-time applied data analyst; teaching, speaking, and collaborating with clients in the healthcare and medical space. Applied data analysis isn't about simply crunching some numbers or writing a bunch of code. It requires subject matter expertise, statistical thinking, the ability to evaluate assumptions and to somehow funnel that into real-life applications. I completed an Executive Education degree from Columbia School of Engineering but this is an ongoing trajectory of learning and doing. But the writing bit is like riding a bike. If that bike is a tiny vespa and it is powered by someone else. I noticed that former writing colleagues are often more secretarial than expertise driven. But here is something that you gain from being in the ring for a long time. Every now and then someone seeks you out. And better yet, they want you to do your job. Doing my job for me allows the team to step out of the way of the data. You can be aspirational. But once the analyses are done--it is time to yield to the facts. Here are a few in no particular order: 1. Ecological Fallacy is real. Findings in aggregated data may not hold at different levels of aggregation. 2. Likert surveys are nothing more than glorified and distorted frequency tables. Oh. One more thing. It is pronounced Lick-ert. 3. If you don't understand conjoint analysis stop pretending that you are gathering meaningful insights from your Likert survey. 4. Unipolar and multi-polar constructs require different scales. 5. You need rank or rating data to apply probabilities to your data insights. 6. Here is a bonus from my work this week. Care utilization is not a substitute for disease burden. Although not entirely planned, this is perfect segue to the graphic below. “When you are learning a new subject, I think the single most useful thing is a good mind map that lays out all the subject areas so you know where the information you are learning fits in. I can remember so many times, sitting in a lecture, having no idea what the prof was talking about and how it related to other subjects. 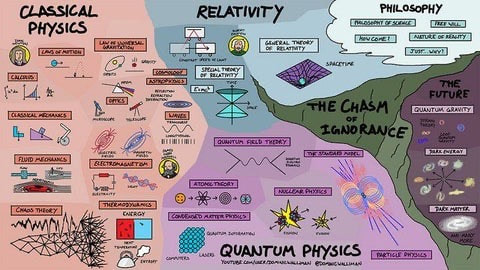 The graphic might be specific to Physics but the application to almost any scientific field should be obvious. Most of the webinars circulating about data visualization or literacy are packaged in a vacuum. Let's call it a cinematic fallacy. You are guilty of taking a cinematic mind map and reducing it to a single linear layer. If you are working in healthcare, the complexity is a necessary element. We need to be loud and bold. We need to identify the Chasm of Ignorance that resides inside us all. We need to lace up our boots and do the hard work.   Seth Godin doesn't care about SEO savvy headlines and you shouldn't either. Many of my journalist colleagues disagree and I get it. We are only as clickable as our cleverest headline written to bring more and more eyeballs to the table. I am no Seth Godin but I also prefer headlines that mean something to me not the Google algorithms that bring short term interest. A stray piece of conversation or a snippet from a podcast that catches my attention will also do just nicely. Look down the list at the last few posts--Go Fund Yourself, A Tabula Rasa in Data Literacy, and Generic but Ambitious--what the hell am I talking about? I don't know. Maybe grab a coffee or tea and take a look. Seth teaches us not to be the thing for everyone--just some people. If you prefer provocative headlines, I didn't make this for you.  Even if you don't think of yourself as a marketer--you are a marketer. Maybe you are the product or maybe your currency is knowledge or expertise but make no mistake we are all selling something. Seth teaches us how to be effective. If you are indeed bringing value to the table you need to find your tribe, stand in front and say--here. I made this for you. This particular blog captured my attention. Not because I need something shiny to look at like a buzz worthy headline but because I trust I will learn something. And when does it get boring? is well worth the quick read. I think Seth and I share short attention spans. In fact, I agree with his method--read along until you get the joke. So why not keep it succinct and to the point? Almost no one who takes an intro to economics course becomes an economist. One reason might be that within a few days of starting the class, it becomes abstract, formula-based and dull.--Seth Godin
I think I surprise many when they find out I am a data analyst. I have always had a wide scope of general interests and this serves me well. Believe it or not, there aren't that many of us that can work the entire end to end strategic data process. We need to know the language, the challenges, and the opportunities. Not everyone needs to be niche driven or highly specific. If you are reading this as one of my data friends or colleagues, here is the perfect podcast for you, Should I Become More Technical or Business Focused in Data Science Career. I began this post in response to a question I field pretty regularly. How much statistics do I need to become a data scientist/analyst/professional? I can't answer that question. Textbooks cram information into your head for an exam. She/he/they who passes the most exams wins and can be perhaps a statistician, mathematician, computer scientist. You need to ask yourself what the long road looks like for you. Where do you want to work? What do you want to be doing? I have completed numerous classes in statistics but I am not a statistician. Weirdly I am also a member of the American Statistical Association. I need to be. I need to keep learning and applying rigor and comprehension to technical topics. Once you get out in the real world and discover your unique flair and contribution, the trick is to remain curious. To use the tools that give "us a chance to understand and to figure things out." Because a testing regime is in place, particularly now when so many other tropes in the education-industrial complex are disrupted, the textbook authors and administrators work together to skip the ‘fluff’ and go straight to the stuff that’s easy to test.--Seth Godin For example, when I think about data modeling and trying figure out the shape of my data, I think about linear, sinusoidal, or quadratic equations. These questions jump from the pages of math books into practical applications when you have variables to consider and relationships to determine. Am I the only one considering positive first derivatives when looking at the COVID-19 curves? All the curves were getting bigger but we needed to consider the rates. They can stay the same, increase slowly, or represent what actually was occurring--the rate was increasing quite rapidly. All applications of the math concepts we were forced to memorize to a test in the absence of how they are applied in the real world. When my boys were small occasionally one or both of them would complain about being bored. My response rarely wavered. I would tell them, "That doesn't sound like being bored, that sounds like a lack of imagination." And off we would go to have an adventure. Speaking of adventures... May 15th we are having a free lunch and learn about demographic data. Register at link Getting comfortable with demographic data. 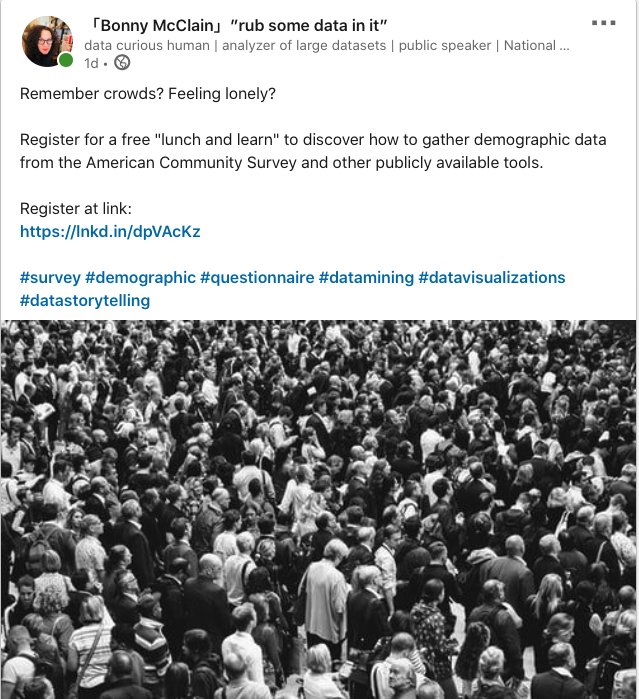
The Last Days of the Art World … and Perhaps the First Days of a New One Life after the coronavirus will be very different.This optimism has all always made me sure that the art world could, and would, survive anything. But last week, that optimism started to die. Even an art-lover lifer like me has to admit much of the art world infrastructure feels like it’s already in the balance. Some of it may be gone even now. In three months, or six months, or — God forbid — 12 or 18 (there has never been a vaccine for a coronavirus)? There will be galleries on the other side of this chasm, and museums, and artists making work, of course. But I worry that such a sundering will only exacerbate the inequalities that more and more dominate this universe, with megagalleries and art stars surviving and the gap between them and everyone else only widening, rendering the scrappier artists and galleries something close to invisible.--Jerry Saltz  Behind the scenes within our data communities we are being cautioned--rightfully so I might add. For once, data is plentiful and mostly ready for primetime. Professionals with the skills to source and clean data for analysis are left behind as data are cast into the miasma for interpretation. Epidemiology has a unique vocabulary and science to explain how we talk about what is known and what is yet to be discovered. My college text book, Epidemiology for Public Health Practice, defines epidemiology as the following, "a discipline that describes, quantifies, and postulates causal mechanisms for health phenomena in populations." A later version (5th edition) says the following, "Epidemiology is concerned with the occurrence, distribution, and determinants of "health-related states or events" (e.g., health and diseases,, morbidity, injuries, disability, and mortality in populations). Epidemiologic studies are applied to the control of health problems in populations. The key aspects of this definition are determinants, distribution, population, and health phenomena (e.g., morbidity and mortality)." I don't know about you but the data we are viewing is often not comparable (confirmed cases vs. actual cases, number of deaths vs. case fatality rates) and most importantly we have no best guess for denominators when testing is sporadic and inconsistent. Limited tests meant subjective determinations of who gets tested. We have already seen the distortion as more data is collected. What we need are less graphics showing the world is on fire and more data collection from asymptomatic members of the population to measure how the virus moves across the entire population. Less data on race and more on structural determinants that underly data collection efforts. It is sad but easy to count mortality rates but we are failing on morbidity attributed to this novel virus. There are a few sounding the alarm to be better stewards of data and to yell questions through the horror we are experiencing. I leave the data collection to them and look to those of us continuing our data centric work through it all to spot the outliers and begin looking for the tell-tale signs of wider data. Over the last decade or so, the art world in peril has seemed to lose the ability to adapt. Or, rather, it now seems able to adapt only in one way, no matter the circumstances: by growing larger and busier. Expansion and more were the answers to everything. The bolded text in the quote above is my own. Substitute data for art--"it’s about eccentricity, risk, resistance, and adaptation." Adaptation based on accumulation and analyses of new information. I bristled listening to NPR asking for data siloed by race. What are we measuring? If you want to examine biology then examine biology--not race. If you want to examine social inequalities give them a name--not race. The heart surrenders everything to the moment. The mind judges and holds back. Ram Dass
Things are often okay--until they are not. I abruptly vacated my month long idyllic trip to an island off the coast of North Carolina. Not because I felt imminent danger but I knew something was off. Rumors were swirling about potential COVID19 positive inhabitants hiding out on the island, the state shutting down the ferry service, or even worse--folks high up on legislative ladder trying to hang on to the farce as long as feasible.
The island had been battered by hurricanes and now North Carolina is coping with visitation by a plague. Done and done. We would be stranded.
I was employed by a top Pharmaceutical company during 9/11 so although there was the right amount of fear and reverence--ginned up by being stowed under staircases until the final plane was accounted for--this feels different. We are all in the same boat, but no idea where we are headed.
Those of us with epidemiology chops know when we are being fed pollyanna inspired bunk. It isn't good news that there are few diagnosed cases if we have no idea how many people have been tested. Or how many tests are available. Or the limits of an already strained healthcare system. Or the plans for managing the onslaught of morbidity arriving within the next 2 weeks... The Johns Hopkins COVID19 Resource Interactive Map
|


| The sheer volume and abundant distortion of claims made in the absence of unbiased and careful review mislead and confuse many healthcare professionals attempting to decide which treatment is best for which patients. I think we all need a tabula rasa or clean slate. Let's start with what we do know and work from there. Think, "less Eureka" and more "what is that?" I am often reminded of continuing medical education where writers are encouraged to step in line to join the lucrative field of writing need assessments for educational funding. A pharmaceutical company will pay a premium for educational interventions that pave the way for their class of drugs or often more boldly--their specific drug. There are not many eureka moments left in healthcare. We need to question the questions and challenge status quo answers. Join me, won't you? |  |
January can be restorative following the chaos of the holidays but often equal parts annoying and cloying as well. You can't swing a pencil without hitting tomes about how to boost your sales in 2020, new books abound that expand the listicle mindset, or other distractions to separate you from your money.
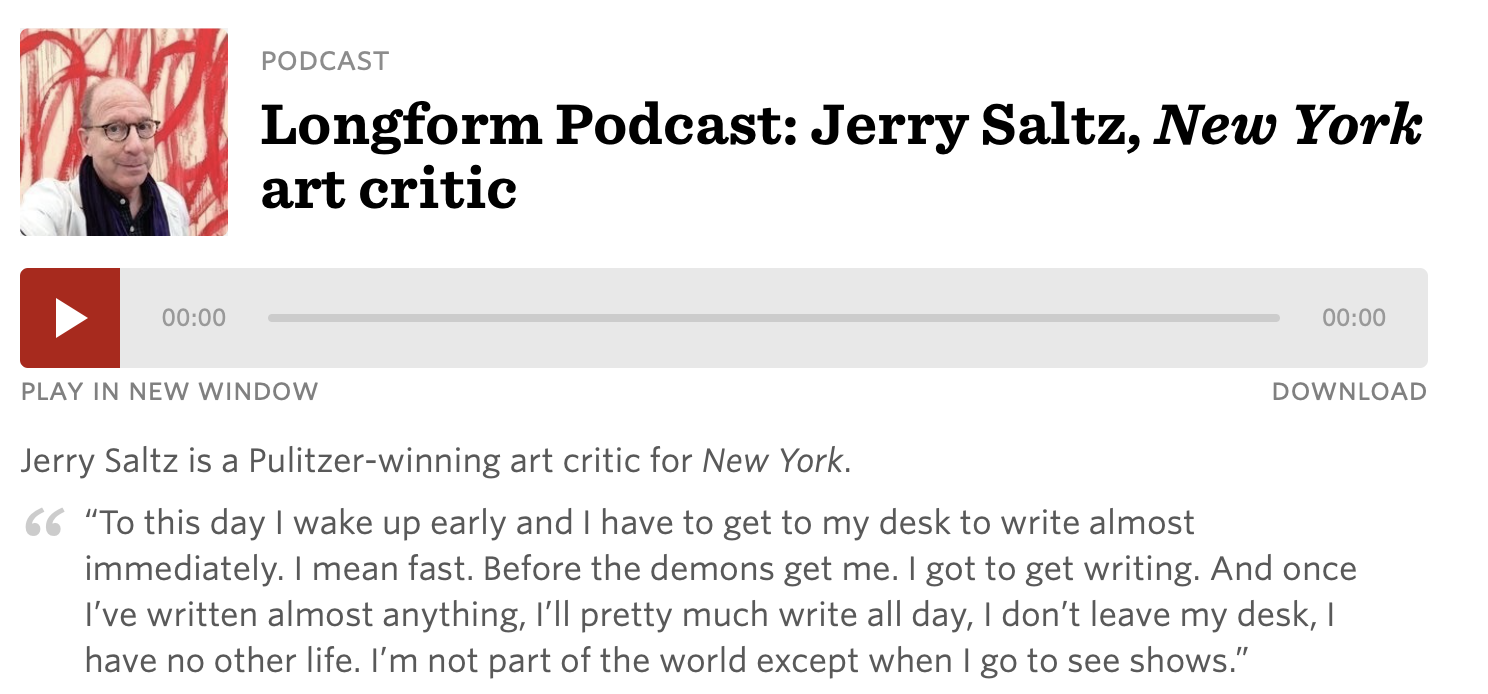
I am going to whisper a little secret, it won't work. What works is hard work. Really hard work. You must consume more than you create. Read, listen, and watch everything. Jerry Saltz described the ordinary brilliantly--"generic but ambitious". I follow Jerry for many reasons--most importantly are his lessons on observation. Yes, I could read the stacks of books falling like manna from the heavens about data visualization. But that is too narrow of a focus. I like edges from other perspectives. I subscribe to ARTFORUM to learn how to consume information. My reality will never be yours, what worked for me will never work the same way for you, but the hard work will.
I recommend listening to Jerry's interview on the Longform Podcast. He became an art critic in his 40s from a career as a truck driver...his humility and cleverness is and should be industry agnostic. Let me know what you think.
A poem by Wallace Stevens describes my thoughts exactly. This excerpt shares the awareness that 20 men will have 20 unique experiences and will perceive the bridge AND the village uniquely. Read the poem in its entirety here.
Metaphors of a Magnifico by Wallace Stevens (1879-1955)
Twenty men crossing a bridge,
Into a village,
Are twenty men crossing twenty bridges,
Into twenty villages...
A recent article in the New England Journal of Medicine, and reported by the New York Times reminded me of those vapid real-estate reality shows. A couple looks at a perfectly serviceable home in need of a bit of sweat equity but declare the house a failure--"Oh I could not live with that wallpaper, can you show us something else?".
In the case of the medical literature I don't know whom to blame first, the shoddy media coverage or the confusing study design. The wallpaper can be changed folks.
In the case of the medical literature I don't know whom to blame first, the shoddy media coverage or the confusing study design. The wallpaper can be changed folks.

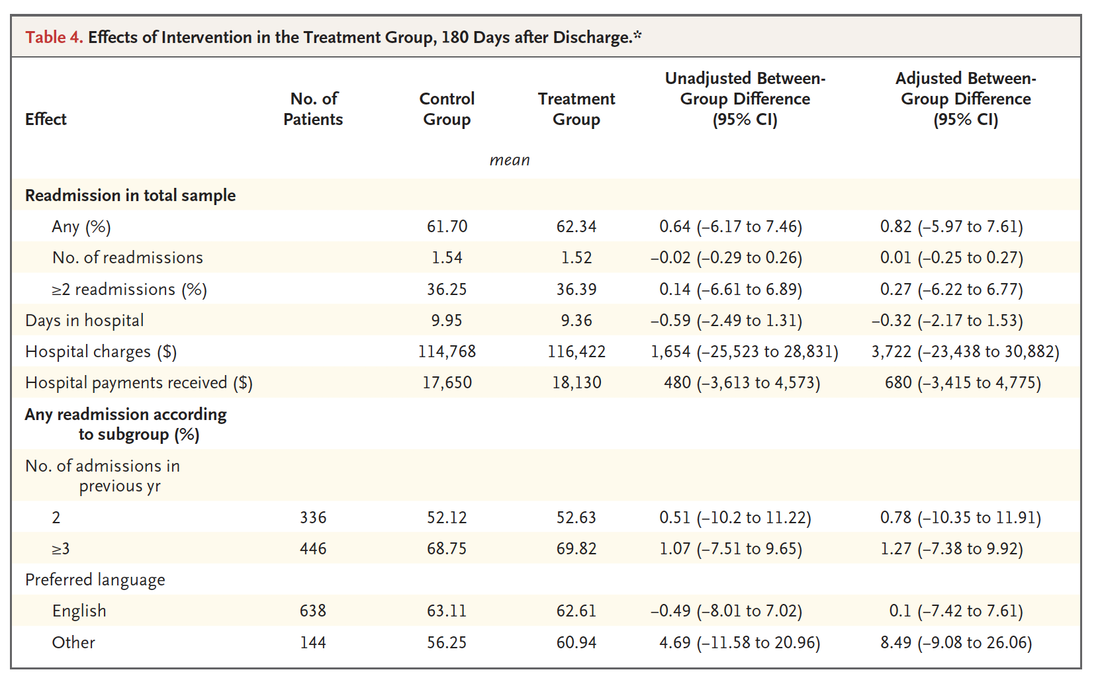
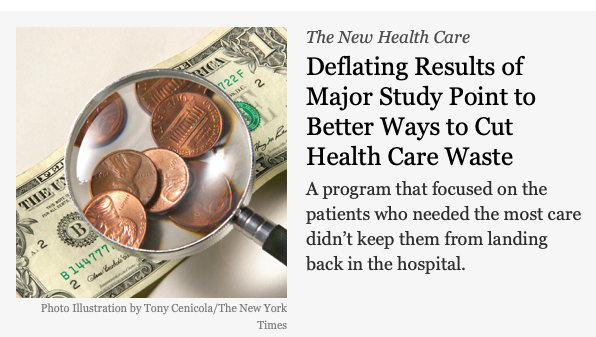 | The article in the New York Times doesn't seem to like the wallpaper and can't see beyond the hype to actually look at the merits or opportunities to query the data in a way that might be meaningful. I am not blaming the brilliant author because let's face it--he didn't create the headline. But I am blaming the metric--avoiding repeat hospitalization or hospital readmission rates. Maybe we should look earnestly into better measures for this highly edited study population. |
The study has quite robust inclusion/exclusion criteria for starters.
Inclusion criteria:
at least one hospital admission at any of four Camden-area hospital systems in the 6 months before the index admission,
at least two chronic conditions;
and at least two of the following traits or conditions:
use of at least five active outpatient medications,
difficulty accessing services,
lack of social support,
coexisting mental health condition
active drug habit, and homelessness.
Exclusion criteria:
uninsured
cognitive impairment
oncologic care or had been admitted for a surgical procedure for an acute health problem, for mental health care (with no coexisting physical health conditions), or for complications of a progressive chronic disease for which limited treatments were available.
Assuming that most readers of the article are simply going to think the program was unsuccessful, here are a few tools (below) I am pulling into the data literacy workshop so we can continue to question questions while also questioning answers. Follow along for insights from the workshop. I don't want to reveal to much here as discovery and discussion will be in "real time."
CMS defines readmission rates within the 30 day time-frame in order to capture events most likely associated with the independent admission. I am assuming then that a 180 day time-frame is a bit noisier.
"Readmission and death rates are measured within 30 days, because readmissions and deaths after a longer time period may have less to do with the care gotten in the hospital and more to do with other complicating illnesses, patients’ own behavior, or care provided to patients after hospital discharge."--Medicare.gov
Hospital Compare datasets
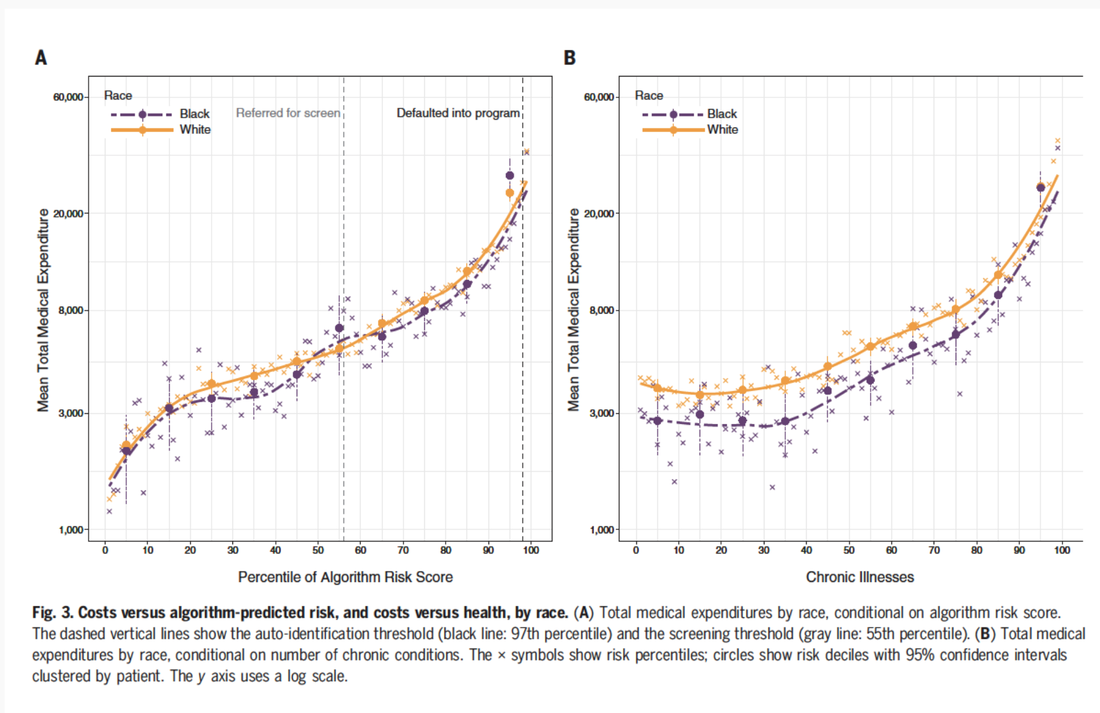
Dissecting racial bias in an algorithm used to manage the health of populations
What does race have to do with it (link to discussion of bias)
Graphical presentation of confounding in directed acyclic graphs
Health Care Hotspotting--A Randomized, Controlled Trial
Supplement to: Finkelstein A, Zhou A, Taubman S, Doyle J. Health care hotspotting — a randomized, controlled trial. N Engl J Med 2020;382:152-62. DOI: 10.1056/NEJMsa1906848
Trouble accessing clinical research articles? Try Sci-Hub...
CMS defines readmission rates within the 30 day time-frame in order to capture events most likely associated with the independent admission. I am assuming then that a 180 day time-frame is a bit noisier.
"Readmission and death rates are measured within 30 days, because readmissions and deaths after a longer time period may have less to do with the care gotten in the hospital and more to do with other complicating illnesses, patients’ own behavior, or care provided to patients after hospital discharge."--Medicare.gov
Hospital Compare datasets
Dissecting racial bias in an algorithm used to manage the health of populations
What does race have to do with it (link to discussion of bias)
Graphical presentation of confounding in directed acyclic graphs
Health Care Hotspotting--A Randomized, Controlled Trial
Supplement to: Finkelstein A, Zhou A, Taubman S, Doyle J. Health care hotspotting — a randomized, controlled trial. N Engl J Med 2020;382:152-62. DOI: 10.1056/NEJMsa1906848
Trouble accessing clinical research articles? Try Sci-Hub...
A recent study, Dissecting racial bias in an algorithm used to manage the health of populations sheds some light on how to reform how we evaluate interventions targeted toward social determinants of health.
The bias introduced in an algorithm widely used in hospital systems revealed that black patients were considerably sicker when compared to white patients at the 97th percentile metric--a qualifier for being referred for additional supports. Although the use of healthcare costs appears to be an effective measure to indicate interventions successful in managing patient outcomes--the racial biases are evident.
The bias introduced in an algorithm widely used in hospital systems revealed that black patients were considerably sicker when compared to white patients at the 97th percentile metric--a qualifier for being referred for additional supports. Although the use of healthcare costs appears to be an effective measure to indicate interventions successful in managing patient outcomes--the racial biases are evident.
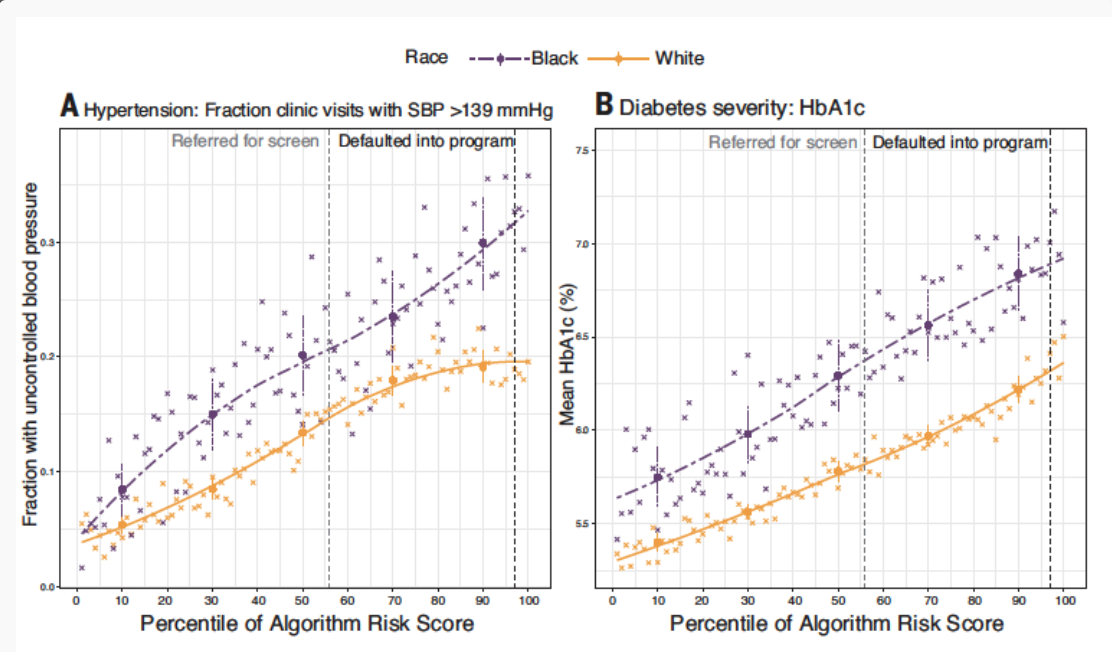
When the algorithm score is replaces by number of comorbid conditions vs. medical expenditure a more equitable referral pattern is observed at the 97th percentile.
I have reviewed the supplemental data from the "Hot-spotting" article and will be reviewing in more detail in future posts. I don't want to "spoil" the end for folks enrolled in the workshop! But stay-tuned...
The authors are planning additional analyses and I anticipate insights regarding improvements in a wider variety of patient populations. Often being ambitious is not the only goal--we need to be curious--not generic.
The authors are planning additional analyses and I anticipate insights regarding improvements in a wider variety of patient populations. Often being ambitious is not the only goal--we need to be curious--not generic.
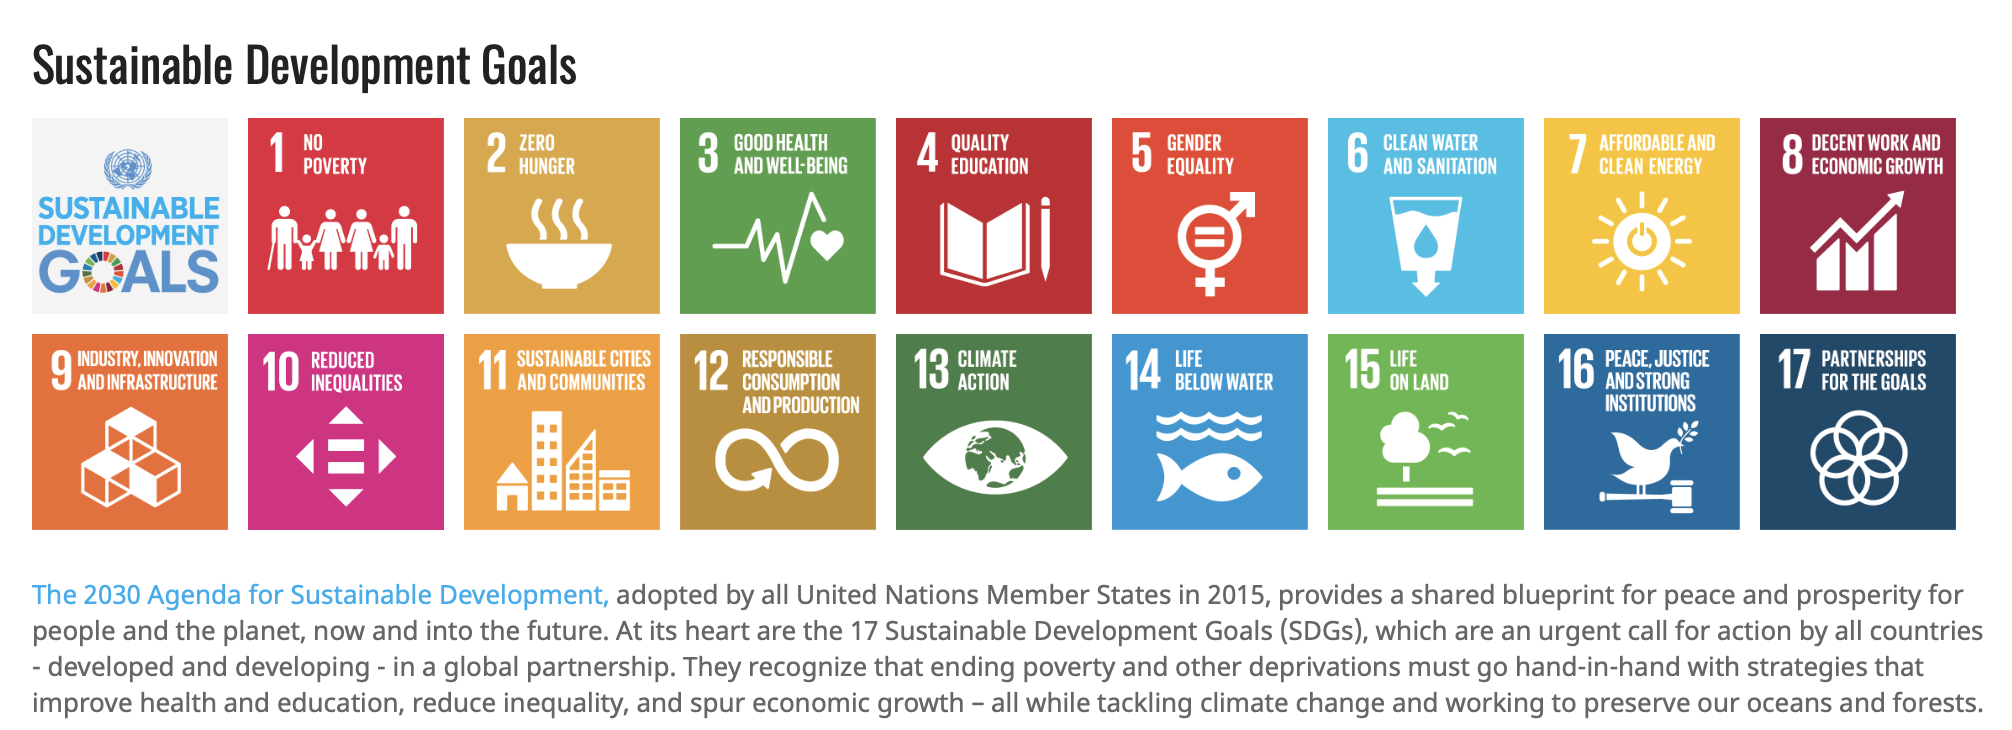
Future data workshop "buckets" to highlight Envision2030
The writer is an explorer. Every step is an advance into new land--Ralph Waldo Emerson

I wanted to create an end-of-year tome that would encourage and dare I say inspire. But like everything in the last few months--the best of intentions are strewn across the laundry room floor--or quite possibly that is actual laundry.
I am not a big fan of listicles or self-adorned professionals insisting they know best or can help you with your journey. There are no shortcuts period. Do the work. If that doesn't yield results, keep doing the work. I probably could have stretched that into an e-book of a decent length but I prefer getting to the joke quickly and succinctly.
The reason I ran over 1000 miles last year is because most people don't. I get up before dawn--most people don't. I don't eat meat and rarely drink. I don't read fiction. I meditate while swimming a slow silent mile. We all have little levers and oddities that yield an advantage in how we live our professional lives or even personal lives for that matter.
I also don't accept advertising or have a "real" job. I watch people with platforms tell us how to improve or create our work from the security of a 9 to 5 gig that pays the bills. I am basically unemployed or unemployable by most metrics but I am booked through March 2020. See what I did there?
I write books, I speak from the podium, I teach data workshops, and as of 2020 I will be fading away much of the contract work. Why? It's time to take the training wheels off of the bicycle. I have been learning. Enrolled in bootcamps, online executive education programs, and teaching data literacy. I learned to code in Python and dusted off my R code expertise. If you are going to call yourself an analyst you better have the skills to get the job done.
My expertise is in defining data questions, sourcing data, data modeling, curating insights, and weaving a compelling narrative. I am not promising a definitive answer but I am promising that I can hold up my end of the conversation.
Here is a list of some of the best decisions I made in 2019
Podcasts
1619--create an environment where you can question why you include race as a checkbox on your surveys or data collection.
Akimbo
I can't provide links because they are migrating everything to their new platform. But you can search by these titles:
Friction
Systems Thinking
You Should Write a Book
LSE Public Lectures and Events
Ordinal Citizenship
Narrative Economics
Learning from Data: the art of statistics
Sign up for our newsletter!
Browse the archive...

Thank you for making a donution!
