
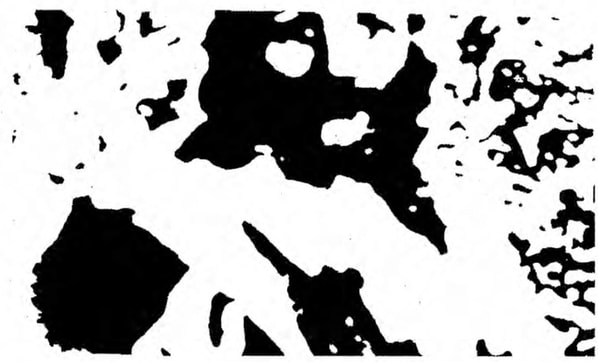
  It should come as no surprise that what you see is not determined solely by the patterns of light that fall upon your retinae. Indeed, that visual perception is more than meets the eye has been understood for centuries, and there are several extraretinal factors known to interact with the incoming sensory data to yield perceptual experience. Perhaps foremost among these factors is information learned from our prior encounters with the visual world—our memories—which enables us to infer the cause, category, meaning, utility, and value of retinal images. By this process, the inherent ambiguity and incompleteness of information in the image—what is out there? Have I seen it before? What does it mean? How is it used?—is overcome, nearly instantaneously and generally without awareness, to yield unequivocal and behaviorally informative percepts.--Thomas D. Albright, On the Perception of Probable Things: Neural Substrates of Associative Memory, Imagery, and Perception Simplifying concepts outlined beautifully in Reductionism in Art and Brain Science* by Eric Kandel, when presented with an object or graphic, prior knowledge or learned visual associations --described as top-down neuronal processing occur. These processes occur after the brain extracts “key elements” of what is known in the physical world and are necessary to help resolve whatever ambiguities remain. As an example, when you first view the image above it may appear ambiguous and undecipherable. With only bottom up processing and nothing to aid in recall we aren’t quite sure of the representation. *As an Amazon Associate I earn from qualifying purchases. Think of the influences our neuronal associative learning has over our interpretation of graphical information. A few decades ago I was participating in a journal club for fellows in internal medicine. They were instructed to basically skip the abstract (can be quite subjective) and head over to the results section. The focus was examining the figures to gleen insights there. What evolved years later was a realization that this approach is also problematic. In the same way that pre-attentive attributes can help direct the eye to important features--they can also mask other insights by drawing the eye disproportionately to where you want the focus. The "look over here and not over" there methodology often distracts from relevant outliers. 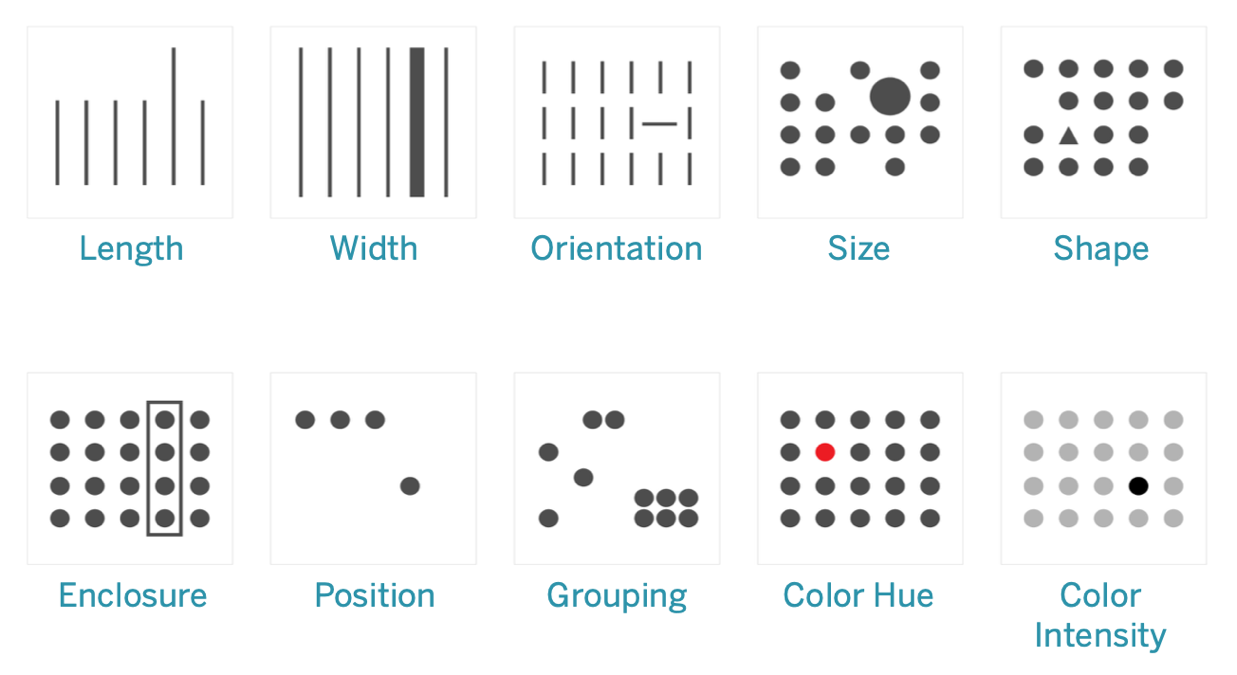 Salman Rushdie in his brilliant MasterClass describes the action happening in the center of works of art. That is where we are intended to look. But then he adds the importance of scanning the periphery as well. Often you will see added context provided by servants or others not deemed the singular objective of the image. When examining graphics for insights, context is everything. Las Meninas by Velaquez is a painting I like to include in my data storytelling workshops. Thanks to Amy Herman and her Art of Perception, a friend and powerful resource for enhancing observation and perception skills for clients like Intelligence, Law Enforcement and Military (Interpol, FBI, Department of Defense) as well as Medicine and Law to name a few--I look at data differently. Art can be a safe place to teach skills needed to clinically review the literature, scan a patient chart, or curate data for relevance and insight. 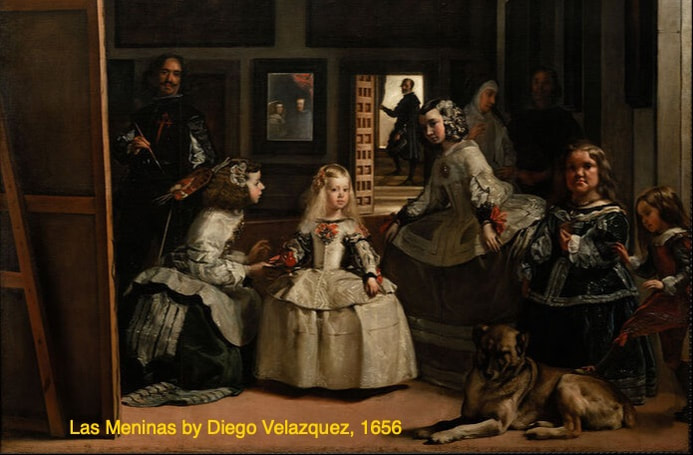 How would you describe the painting? Can you say anything about the perspective of the image? Did you notice the mirror? What does it say about art and reality? Where is the subject? Consider the image below. Now look up at the original black and white patterns above. Now that the top-down processing has a “memory” or association--you can now distinguish the image. 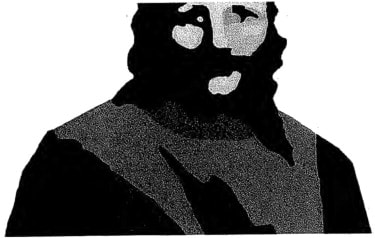 The biggest challenge is often releasing our pre-conceived ideas and leaning into the realm of not knowing, what we don’t know. The opportunity is there. Right outside of the frame.
|

 |
Modern research is showing us that making even slight adjustments to the way we inhale and exhale can jump-start athletic performance; rejuvenate internal organs; halt snoring, asthma, and autoimmune disease; and even straighten scoliotic spines. None of this should be possible, and yet it is. |
I wanted to share this story because many of us are dealing with stressful life events. We are fortunate to be helping plan our son’s wedding, I have a book deal, my youngest is beginning his second college semester safely down the hall, knock on wood we are healthy, employed, happy, and hopeful.
But that is the thing about stress. If you don’t own your own breath, you will not be able to own your own peace.
But that is the thing about stress. If you don’t own your own breath, you will not be able to own your own peace.
| Reductionism might seem a little hoity toity at first glance but you might be surprised how elegantly it applies to not only the brain and art but to data visualization in general. The Matisse on the right, “The Snail”, uses swirling color blocks to mimic the swirl or pattern of a snail shell. This only works if we have seen a snail shell, and our brain knows to compare this image to images stored in our memory.  | 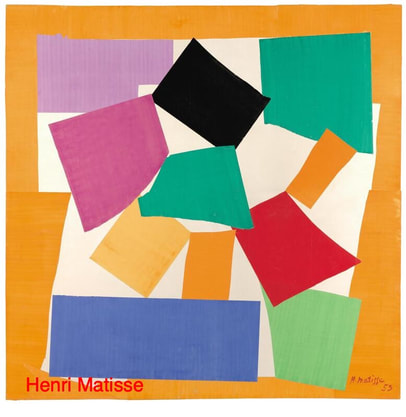 Reductionism is any of several related philosophical ideas regarding the associations between phenomena which can be described in terms of other simpler or more fundamental phenomena. It is also described as an intellectual and philosophical position that interprets a complex system as the sum of its parts.--Wikipedia |
The first example that comes to mind when thinking about reductionism in brain science would be the Punnett square. Those of us with experience studying genetics understand that this isn’t how heredity works from a biologic perspective but this simplistic rendering is helpful in understanding Mendel’s theories of inheritance.
| You may be surprised to learn that Neuroscience was not considered a distinct discipline until the early to mid-1960s. Questions began to surface like these discussed by Eric R. Kandel, “What sort of changes does learning produce in the neural networks of the brain? How is memory stored? Once stored, how is memory maintained?" | 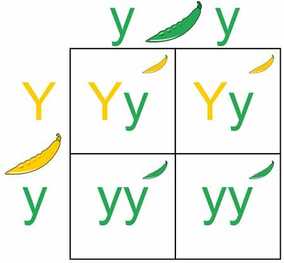 |
This matters upstream from data visualization. We are taught the importance of pre-attentive attributes but not the cautionary tale of how they can unduly influence our perception. These altered perceptions may be conscious or unconscious but as our brains attempt to simplify what we are viewing it is also often adding information that is not actually present--it can distort messages.
This can happen for many reasons but if we recall that visual information is processed on two different pathways, it makes a little more sense. The primary visual cortex processes information that answers the “what” we are looking at toward the bottom of the brain (inferior pathway) while information that responds to “where” is diverted to the top of the brain (superior pathway). Inferior pathway detects faces, shapes, colors, identity, motion--superior pathway is concerned with depth and spatial information. This describes the interplay between pre-attentive and attentive attributes.
This can happen for many reasons but if we recall that visual information is processed on two different pathways, it makes a little more sense. The primary visual cortex processes information that answers the “what” we are looking at toward the bottom of the brain (inferior pathway) while information that responds to “where” is diverted to the top of the brain (superior pathway). Inferior pathway detects faces, shapes, colors, identity, motion--superior pathway is concerned with depth and spatial information. This describes the interplay between pre-attentive and attentive attributes.
Low-level processing occurs in the retina and detects images, intermediate-level processing distinguishes which surfaces and boundaries belong to specific objects, and high level processing integrates information--Reductionism in art and brain science, Eric R. Kandel
When we are observing works of art our brain associates memories of other artistic works in addition to past life experiences. I argue this happens with charts and graphics as well.
Why Visual Analytics? Pre-attentive attributes

...to be continued

I simply don’t enjoy the remote bits as much as I thought I would. Following a series of Zoomy webinar formats (for scheduled speaking events) I felt hollow. Although I request attendees be allowed to raise hands and leave their video and mics live--not one host has acquiesced. Interactivity is paramount to engaging with your data or your data questions no?
Maybe you don’t realize how weird it is but basically you are talking to your own face for 45 minutes to an hour. Narrative stories need an audience--not a theoretical invisible one--a curious and engaged group lobbing questions over the fence. Especially when topics hover around racial bias or underserved populations.
It seems only yesterday I was toying with ideas in search of meaningful dialogue. Finding true merit in a deep river was one such post but there are many. Before COVID I was teaching the data curious how to use CENSUS data to ask meaningful questions around poverty--not the almost 60 year old definition, but actual poverty. I am currently using the blog and newsletter as a data diary. It allows me to get a few ideas out in the world to re-examine once I need to create several talks a month. Maybe I should think of it was an idea library...
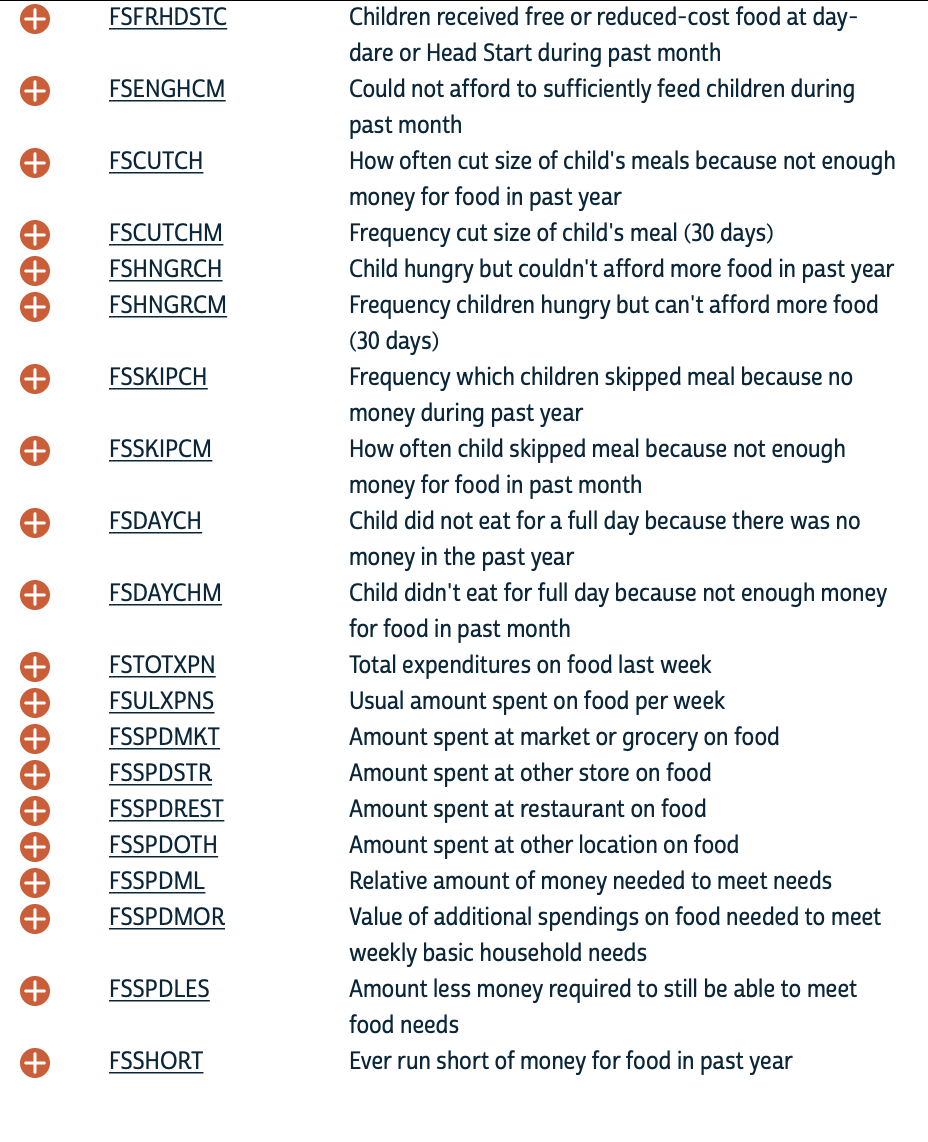
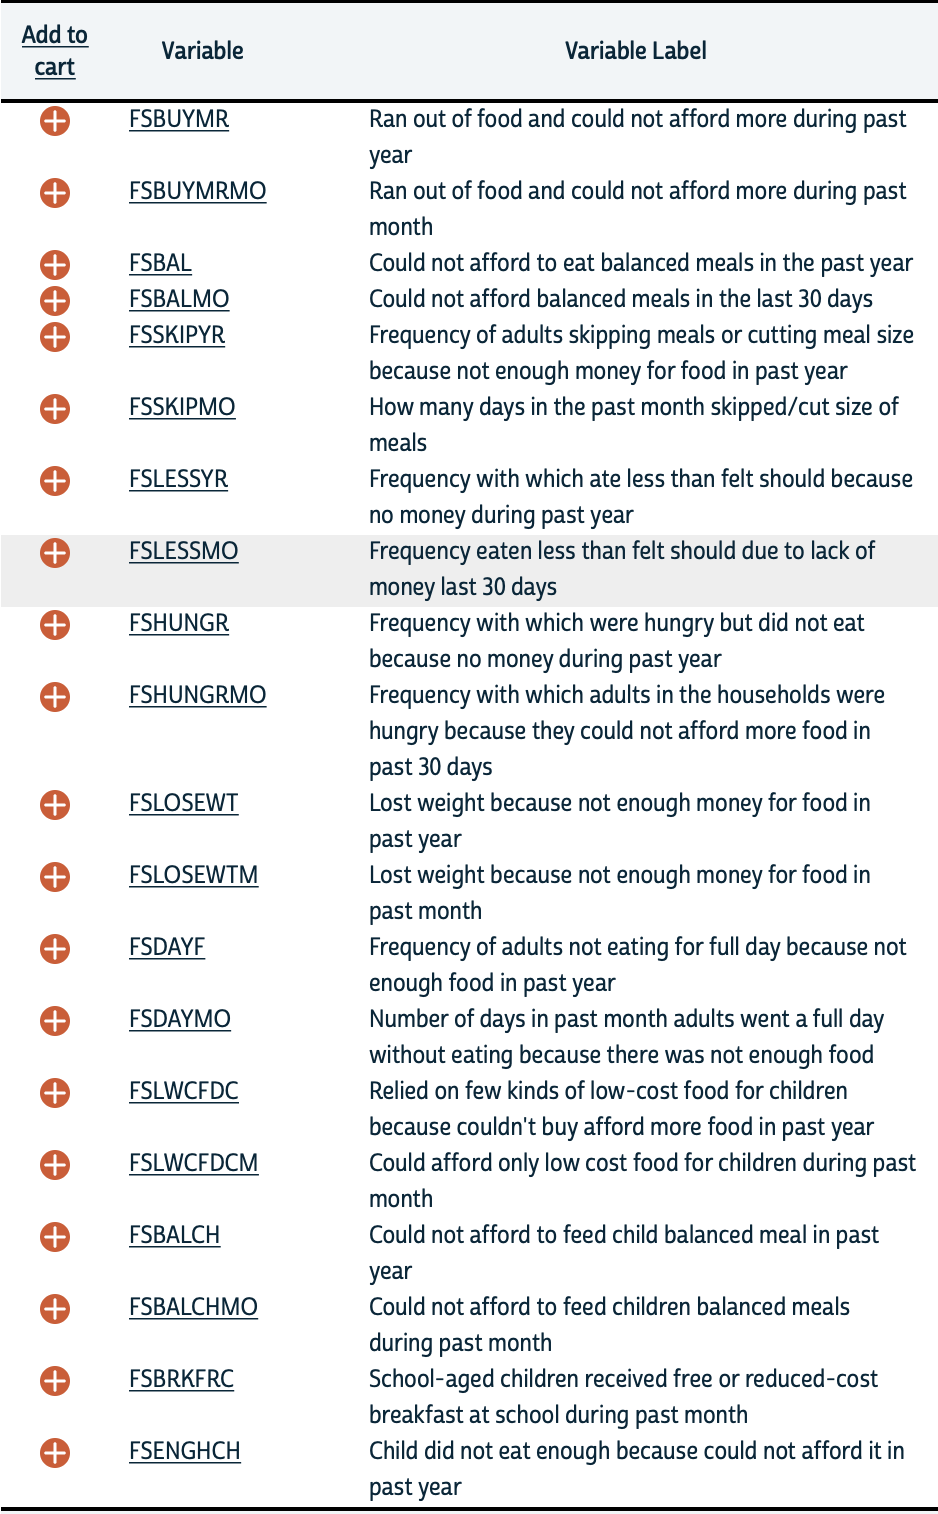
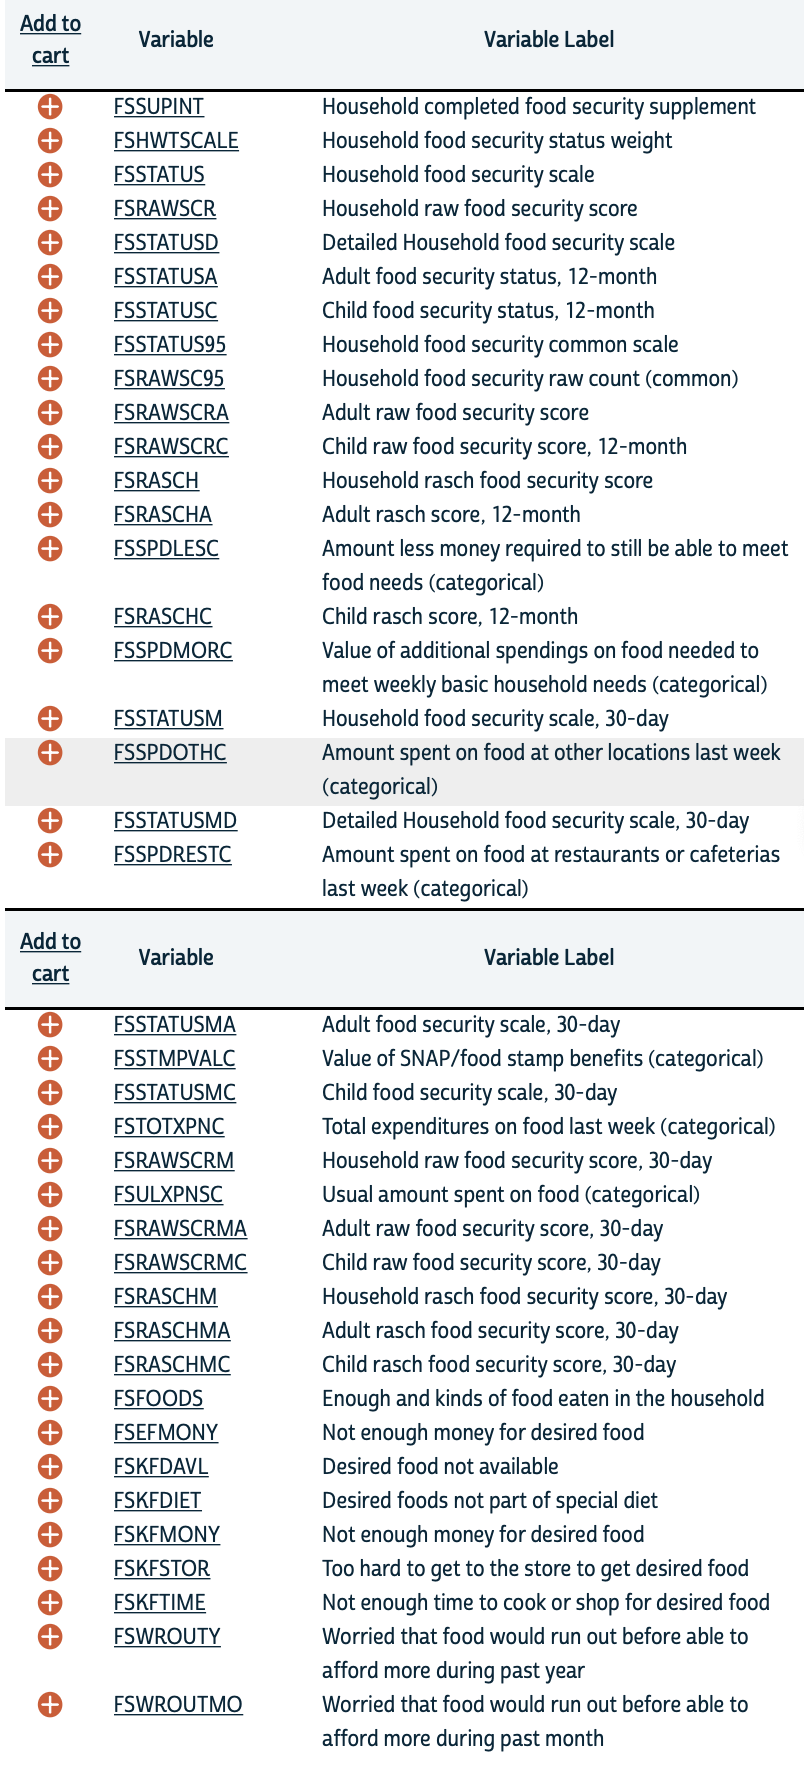
| I have been thinking about Pulse Surveys examining household data (during COVID 19). The food security issue was part of a client project. As the only non-monetary variable included in the original definition of poverty back in the 60s we should be familiar with food policy. Surprisingly the agriculture department has plenty of publicly available data. | 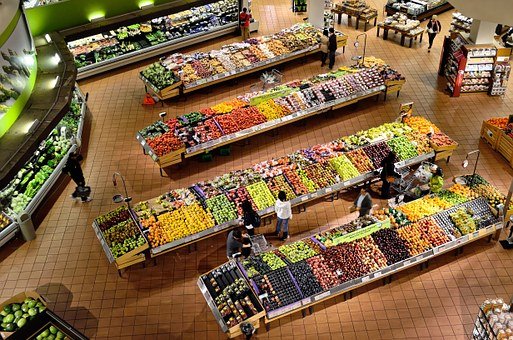 |
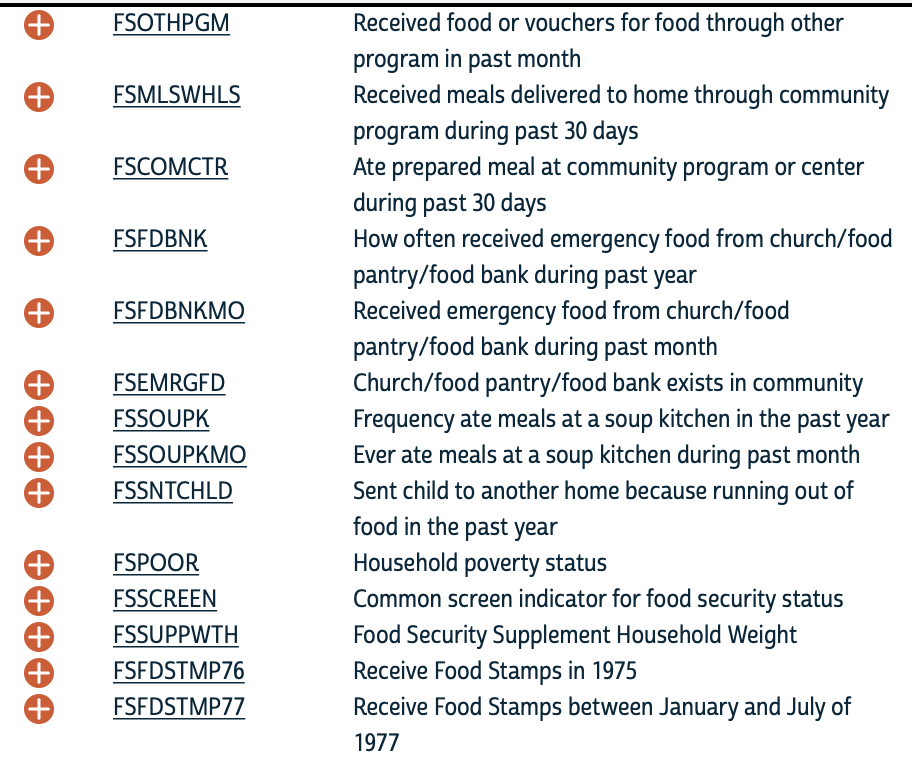
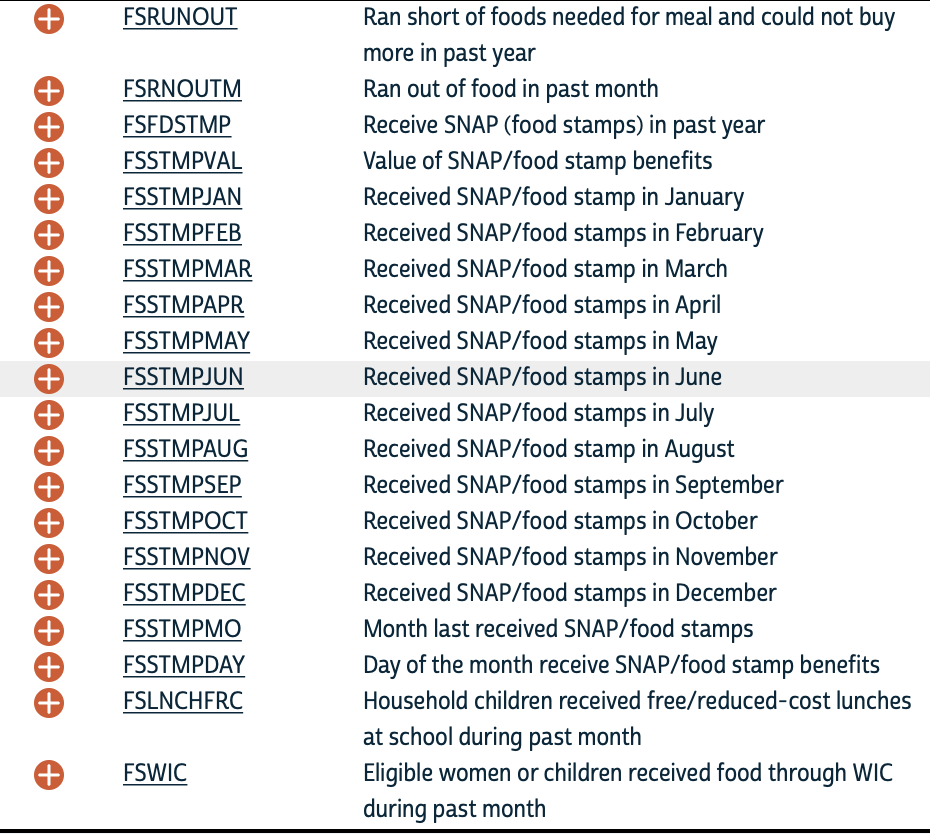
I rely on IPUMS Current Population Survey data for granularity around food insecurity. These variables are the “grammar” you need to create a powerful story.
I am often asked to talk about diversity, under-served populations, and bias in healthcare algorithms. Digital racism although well meaning, ignores the system level problem. While we are frantically shining flashlights in the darkness of our ignorance--there is a menacing commonality to all of the chest pounding and activism.
We were founded by racism. Plain and simple. The sooner we all get onboard the sooner we can create policy to address these social constructs that marginalize and limit opportunities for all of our citizens. Did COVID really create a racial divide in education, healthcare, and economies? Or did it reveal what has always been there? Providing meals, safety, upward mobility, socialization, an education--a daunting task for the nation’s poor.
Think of the evictions. How many of you have heard of the McKinney-Vento Homeless Assistance Act? It is the primary legislations responsible for educating at-risk children and those facing or experiencing homelessness. Yes, it is easier to blame floundering governors and mayors for keeping schools closed, then opened, and then closed again.
We need to revisit what is contributing to homelessness--A wave of evictions is on the horizon. What impact could they have on kids' education?But I suggest the story is around how “access” is being defined and how already cash-strapped communities are intended to fund additional support.
And when we discuss remote learning there is historical precedence and research we need to consume. Where Platform Capitalism and Racial Capitalism Meet: The Sociology of Race and Racism in the Digital Society
As the state legitimizes the use of digital and algorithmic decision making, it also creates new data worlds (Gray 2018; Milan and van der Velden 2016) to which few sociologists have access. The inaccessibility of these data is part of their value to state and capital interests. Private data worlds where decision making can be veiled from democratic inquiry fuel economic and political commitment to more datafication. This brings about more secrecy.--Tressie McMillan Cottom, Where Platform Capitalism and Racial Capitalism Meet: The Sociology of Race and Racism in the Digital Society
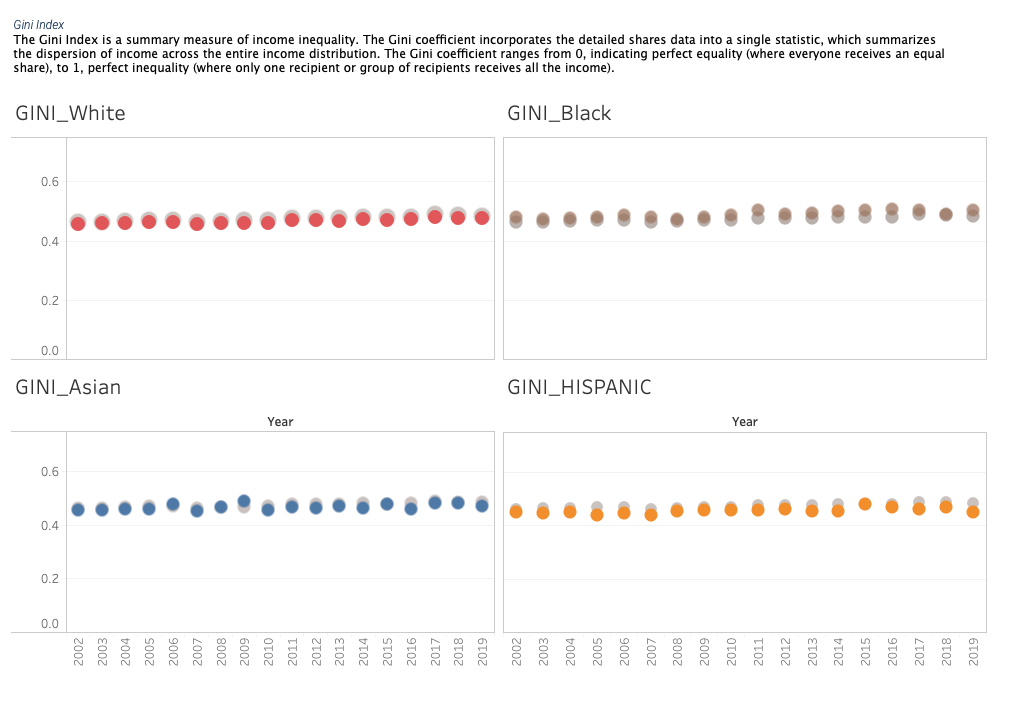
The Gini index below shows how black populations experience higher rates of inequality. Yes, there is a little more to it but you can see how developing skills around data sourcing and formulating meaningful questions can add much to curating empathy and insights.
Library...


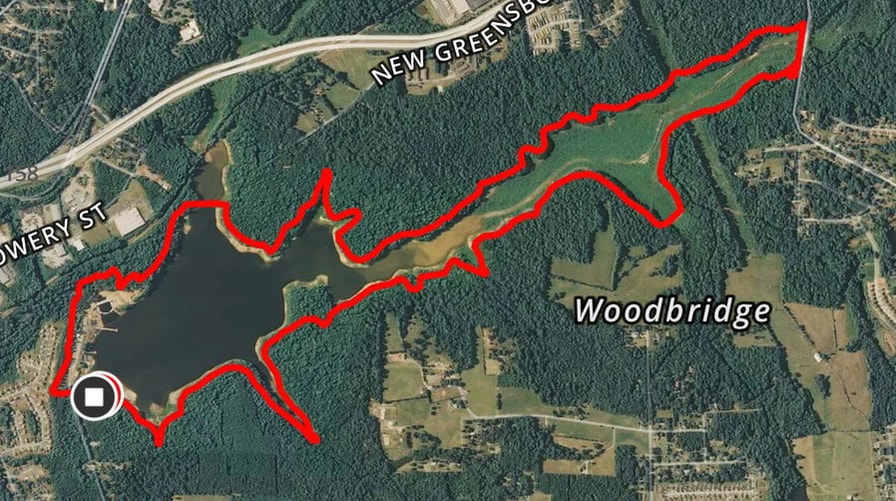
| I needed a minute. Distractions only take you so far and then you need to focus and make a plan. We all go through times of stress--the difference is how we manage these moments. People overeat, play video games, take walks, smoke, and a wide variety of other positive and negative coping mechanisms. I try to lean in to behaviors that can better serve my goals. | I prefer to go out on long solo runs on the trails. I queue up a list of podcasts that reflect my curiosity in work-related topics, life in general, and creativity. I have been studying spatial data science and cartography for a large project and I simply needed to clear my brain for the next round of analyses. |

I teach workshops examining the data layers contributing to poverty. This doesn’t happen in a vacuum. I read many books to influence where to look for data but I listen to podcasts like Code Switch. A recent podcast reminded me that when voting data was reported based on younger cohorts and racial categories--it wasn’t real.
We don’t have the data yet and it could be a minute before we distill the data to that level.
We don’t have the data yet and it could be a minute before we distill the data to that level.
Five quick lessons for improving your data literacy
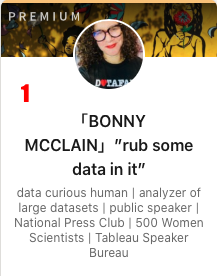 Nobody cares that you are looking for a job. What are your unique skills and interests? Never stop learning. I am taking several MOOCs from ESRI.com. Geospatial analysis is more than just geocoding data onto a map. There is a rich dimensionality allowing data to better inform. Use data for good. Capture metrics to find out what type of visualizations, topics, or stories resonate with the bulk of your subscribers. In my case, the poverty data I was capturing from CENSUS data only used location for drop a pin in a spot on a map. I was leaving data on the table. Exploring geospatial analytics allowed me to pursue suitability models--and learn new tools for spatial data science. What are some of your new tools? | LinkedIn You are woefully underutilizing the latent potential of LinkedIn. I don’t take it too seriously. I have fun with it and use it as a portal for interested peers to reach me. Period. Look at the area under my photo. If you aren’t using it to display your personality or special skills, change that today. There is a saying out on the trails, especially if you are an ultra runner. When you fall, and you will fall, don’t blather about it--rub some dirt in it and keep going. 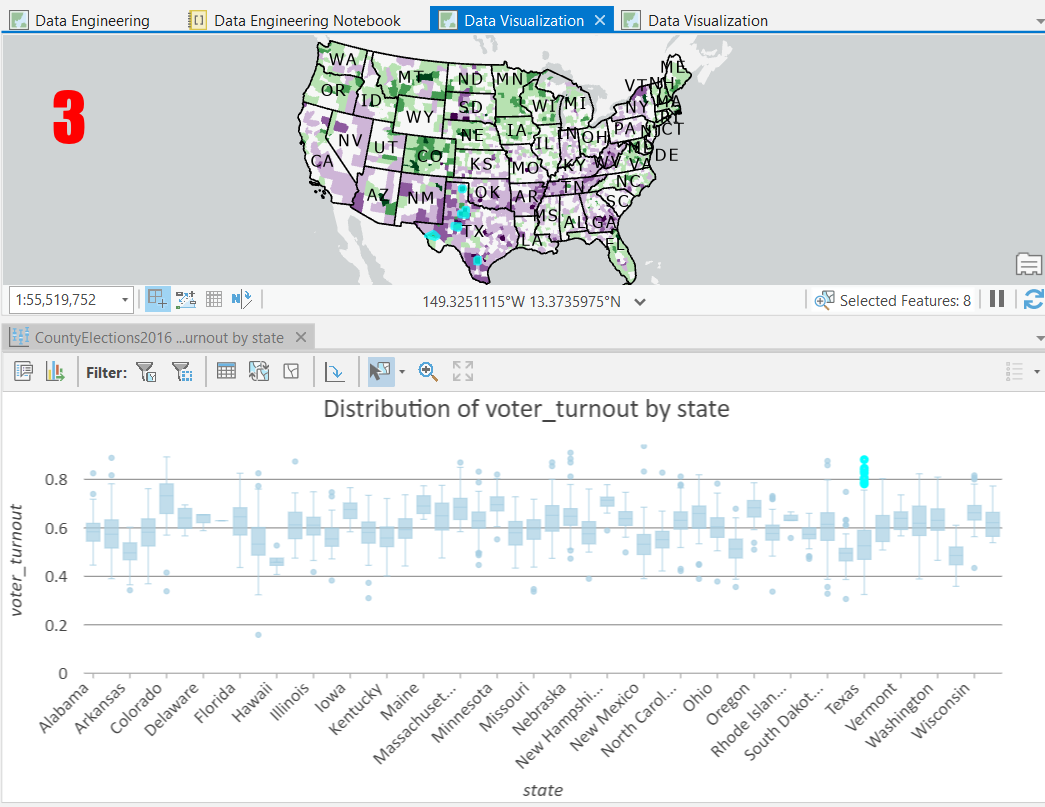 I am surprised to say this but I think I am in good company. Or a bad omen. “The unexamined life is not worth living” quoted by Socrates before being sentenced to death does yield some truth. I don’t know why my blogs trend so well in Metro Manila but there you go. Don’t write for likes but like what you write!   |   This could be putting a bullet in my own foot but in a world where everyone is an expert--err on the side of foundational learning. The type of learning that doesn’t become obsolete after the next release. Truths that can stand the test of time. Andy’s book is that for me.  Your mileage may vary but the point is to embrace the tidal seasonality of learning. We have the time right now and we can all benefit from careful thought and contemplation. |
"If I had an hour to solve a problem and my life depended on the solution, I would use the first 55 minutes determining the proper question to ask, for once I know the proper question, I could solve the problem in less than five minutes."
--Albert Einstein (1879-1955)
Data literacy is a popular buzz word lately. Often cited as an organizational goal or an individual professional metric but you might be surprised how blurry the end game might be. How do you define success? When are you considered “literate”? And why are courses delivered in soothing dulcimer tones? Where are the challenges and limits? The solutions are not marketable and should be evolving with the complexity of our data questions.
Morgan Freeman wasn’t necessarily referring to data in the opening quote (in the title) but you can see why I made the leap. Better data, better questions, better insights. We need to curate empathy not the next gizmo for sale.
In my opinion, this is mission critical. You can design, sell, even give-away the alleged “secret sauce” but make no mistake--this is more than what chart to use to display your data or how best to create a visualization.
The decisions you make upstream to tool selection are more important than the tool itself. We don’t have the luxury of mistaking an ideology for an effective solution to complex problems. Tableau is trying to make introductions to data literacy that albeit a little late to the party--might help guide us all in the right direction.
My main criticism is that all roads to literacy appear to be paved with Tableau products but having said that--Tableau Public is free and can certainly launch you on a journey of data discovery. When I teach data literacy--especially since my audience is typically underserved populations or adult learners--I share free resources along with the paid alternatives.
Because if literacy is not equitable, what is the point?
CENSUS data
Data literacy requires actionable insights and workflows. Although many of us work with large datasets (especially in healthcare) I spend much of my time in Census data files.
Here are the buckets from the Tableau data literacy initiative. The next few posts will explore how these apply to an actual data set.
Here are the buckets from the Tableau data literacy initiative. The next few posts will explore how these apply to an actual data set.
- Introduction to data literacy
- Recognizing well-structured data
- Exploring variables and field types
- Exploring aggregation and granularity
- Understanding distributions
- Understanding variation for wise comparisons
- Using correlation and regression to examine relationships
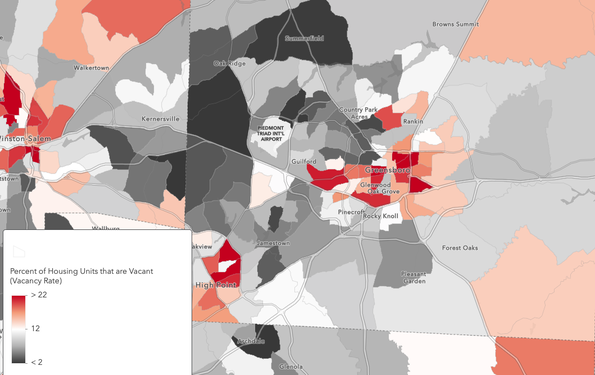
For example, when I want to examine poverty or racial inequity I know there is a variable in the Census data that will look at vacancy rates. This is exploratory data analysis but I need to find the data.
I skipped ahead simply to show you how I might do a little front end research to figure out where I might begin to find meaningful variables. I remember a project in Los Angeles where there was an association made between poverty, race/ethnicity, and percentage of multiple family units.
This data is also captured by Federal Government and economic forecasters to gauge the economic environment.
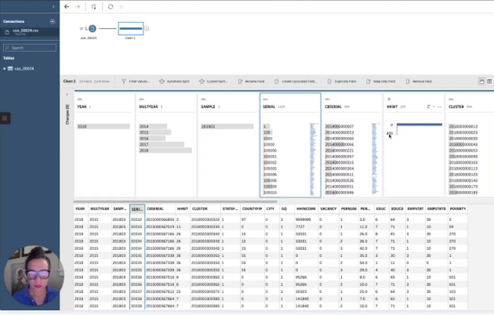
When working with Census data you need to know which tables contain the data you hope to explore. I know that B25004 has the data. I have spent more time with the 2018 data but we do have access to 2019 although with limited geographical files so I rely on acs5 for 5-year data in real life but for purposes of this quick look here is what I am sharing.
I skipped ahead simply to show you how I might do a little front end research to figure out where I might begin to find meaningful variables. I remember a project in Los Angeles where there was an association made between poverty, race/ethnicity, and percentage of multiple family units.
This data is also captured by Federal Government and economic forecasters to gauge the economic environment.
When working with Census data you need to know which tables contain the data you hope to explore. I know that B25004 has the data. I have spent more time with the 2018 data but we do have access to 2019 although with limited geographical files so I rely on acs5 for 5-year data in real life but for purposes of this quick look here is what I am sharing.
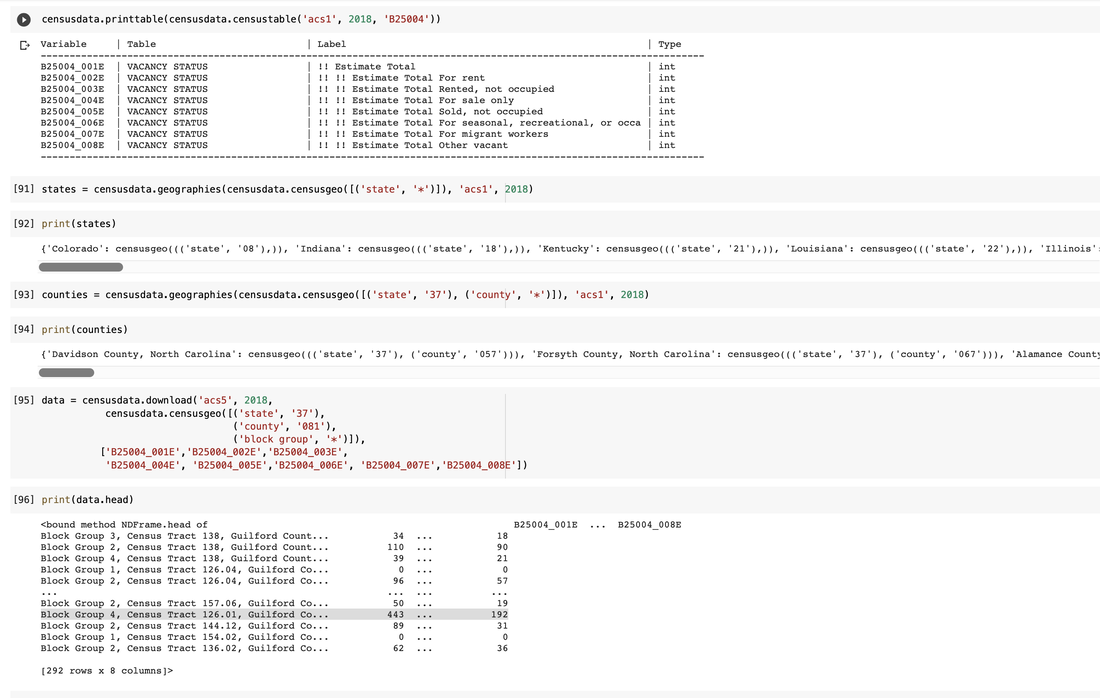
Briefly, I share how to find the codes for your state or county level data and how you bring the data into Colab for a rapid Python analysis. From my less than 10 minute query above I know that I might be interested in Block group 4, census tract 126.01 to explore vacancy rates and other attributes in the area.
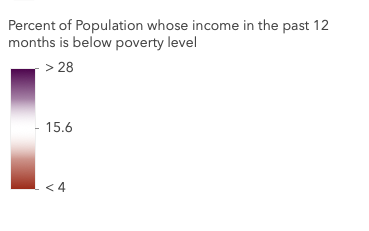
A quick look in ArcGIS allows me to explore poverty levels in my local county to see if there are any trends. We notice that purple is displaying higher percentages of the population whose income in the past 12 months is below the poverty level. The next step for me would be to redefine poverty as the definitions we work with in government settings were articulated in 1963 and include income and only food expenses. It is out of date but we are able to define a wide variety of other variables better suited to identify contributions to inequity.
A quick look in ArcGIS allows me to explore poverty levels in my local county to see if there are any trends. We notice that purple is displaying higher percentages of the population whose income in the past 12 months is below the poverty level. The next step for me would be to redefine poverty as the definitions we work with in government settings were articulated in 1963 and include income and only food expenses. It is out of date but we are able to define a wide variety of other variables better suited to identify contributions to inequity.
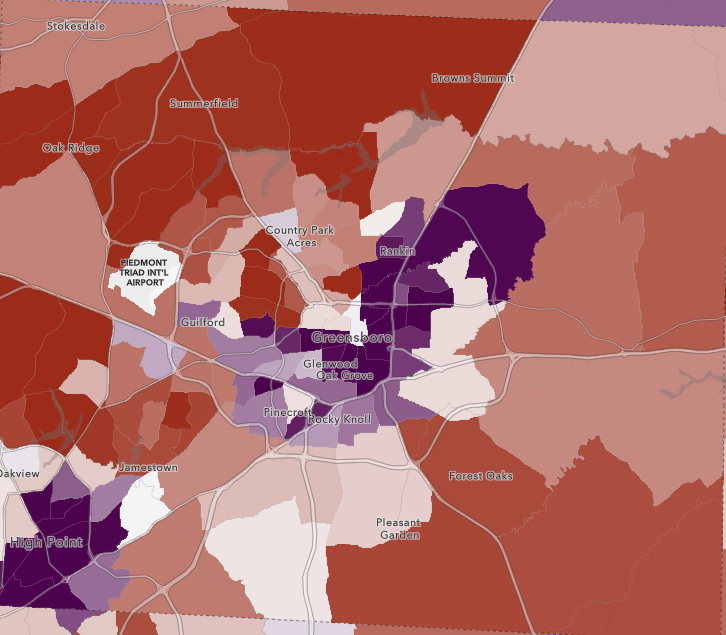 |  |
Think about overlaying the visualization below and see if you see patterns between vacancy rates in communities and where the poverty levels are highest. The dataset I normally work with has 62 variables all culled from census data. More to come...
Subscribe below for more insights...
Click below to see a story map created in ArcGIS...
On the edge of what we know, in contact with the oceans of the unknown, shines the mystery and the beauty of the world--Carlo Rovelli

This weather. It seems like a whisper of possibility--of something shinier just around the corner. I queued up a playlist of podcasts covering ultra running, culture, data science, economics, medicine, and literature. You would think these are disparate topics united only by an individual runner’s eclectic preferences but you would be wrong. Edges are where I get my best ideas. Think of your interests. The books you read, the ones you don’t--the music you like or hate. I use these early morning runs to clear my mind--and if it is a good morning, I might learn something new.
After the Fact is a podcast produced by Pew Charitable Trust. Conversations on Science: What Makes Science, Well Science is a brilliant series. Here is the transcript. Theoretical physicist and writer, Carlo Rovelli reminds us that we need to gather many lenses to make sense of our world.
I discover most books from author interviews on podcasts. Seven Brief Lessons on Physics* is the latest. *I get a few shiny nickels if you order the book from the link--full disclosure--but cost to you is the same. It is about as far into advertising as I can lean. It makes sense to me. Its like you are tossing a few nickels out of Jeff Bezo’s pocket into mine. Thanks!
This book is great for many reasons but my favorite is why Carlo decided to write it. I remember college physics, it was many things but brief it was not. He says he doesn’t like details. For example, we can be interested in butterflies for example--without reading a 700 page book on everything there is to know. Maybe some things you are willing to absorb at face value. He shares the beauty of physics without having us calculate which train arrives at the station first.
Something that has stuck with me is how he defines science or better yet provides context.
"Science is a tool that we have. And we should not mistake a tool with our ideology or our objective."
Boom. This reminded me of professionals teaching data skills or data visualization. I lead my workshops with a bit of context. I approach data problems as a tool agnostic professional. Yes, I spend a lot of time working with Tableau but the more tools you have--not restrained by ideology--the better you will navigate the alluvial framework of our new remote work lives. Think about Python, R, ArcGIS, and SQL.
I am finishing up this post listening and watching the Tableau Conference-ish, reimagined for virtual hijinks, knowledge, and networking. I was at Tableau conference in 2016 when election results were announced and I attended the Tableau conference held at Mandalay Bay days after the massacre at an outdoor crowd of 22,000 attending the Route 91 Harvest Festival. Conference has been a time post of the last 7 years.
Here we are again, now ravaged by a pandemic and struggling with racial inequity. I hope we can look to data. I hope we can ask better questions. I would like to see more folks at the table. Many of us have been standing at this table for a long time.
I hope we are ready to add more chairs.
A table, a chair, a bowl of fruit and a violin; what else does a man need to be happy—Albert Einstein
More and more, journalism seems to have hopped out of Truth’s pocket and crept into another--Henry Rollins
There are things I simply can’t explain--my fascination with Henry Rollins being one of them. Or perhaps my persistent curiosity to find the original “thing”.
Let me explain. When I hear or read a story I want to know where it was seeded.
Who created the idea that germinated into this shiny product I am consuming.
Let me explain. When I hear or read a story I want to know where it was seeded.
Who created the idea that germinated into this shiny product I am consuming.
Nature has it wired. Cancer, plague, viruses, parasites and other grotesque, microscopic killers are there to thin the herd. Of course we fight back. This being the case — along with other factors such as our inability to always play well with others — not everyone is going to have a long, healthy life.
American capitalism is a blade. It’s going to disembowel someone. On a good day, it’s not you.--Henry Rollins March 23, 2017
The raw truth is what I crave. Perhaps I never get there but the telling is in the journey. It might be why I needed to create this platform. A place where I can toss up some ideas or better yet--run them up a flag pole and see if anyone salutes.
Maybe that’s why I retired from medical writing. Medical writing is about telling a narrowly defined truth based on limited data and polished to a shiny hue illuminated with profit and false narratives. Okay. It sounds a bit harsh but if we poke a little deeper there is something crumbled and stale in the pocket of truth. We aren’t talking about health care. We are talking about disease care.
Conversations about health should address structural determinants of health. How do we alleviate the unequal distribution of power and resources in our communities? Instead we wring our hands and lose the focus. We label the buckshot and start dismantling the assault in a piecemeal manner. The best intentions are littered with discussions of race, gender expression, and class. Divide and conquer strategies might explain why we are still having the same conversations. If we address the cause instead of the symptoms, perhaps effective policy will follow.
Whether with respect to race, ethnicity, gender, class, or other markers of human difference, the prevailing American narrative often draws a sharp line between the United States' “past” and its “present,” with the 1960s and 1970s marking a crucial before-and-after moment in that narrative. This narrative asserts that until the 1950s, U.S. history was shaped by the impacts of past slavery, Indian removal, lack of rights for women, Jim Crow segregation, periods of nativist restrictions on immigration and waves of mass deportation of Hispanic immigrants, eugenics, the internment of Japanese Americans, the Chinese exclusion policies, the criminalization of “homosexual acts,” and more (Gee and Ford, 2011; Gee et al., 2009). White women and people of color were effectively barred from many occupations and could not vote, serve on juries, or run for office. People with disabilities suffered widespread discrimination, institutionalization, and social exclusion.--Communities in Action: Pathways to Health Equity
There is hard work to do when you want actionable answers. The history of our country is shameful, but it didn’t happen in a vacuum. Reading about James Madison we realize that although we celebrate him as a founder of our country, he also argued that white land-owning men were best suited to lead our nation or to have a vote in how our nation was to be led. They represented only 6% of the population at the signing of the founding documents.
It seems coincidental to have discovered a book that changed my thoughts and awareness on such a cellular level in a book shop on his former plantation. The Half Has Never Been Told: Slavery and the Making of American Capitalism by Edward E. Baptist.
It seems coincidental to have discovered a book that changed my thoughts and awareness on such a cellular level in a book shop on his former plantation. The Half Has Never Been Told: Slavery and the Making of American Capitalism by Edward E. Baptist.
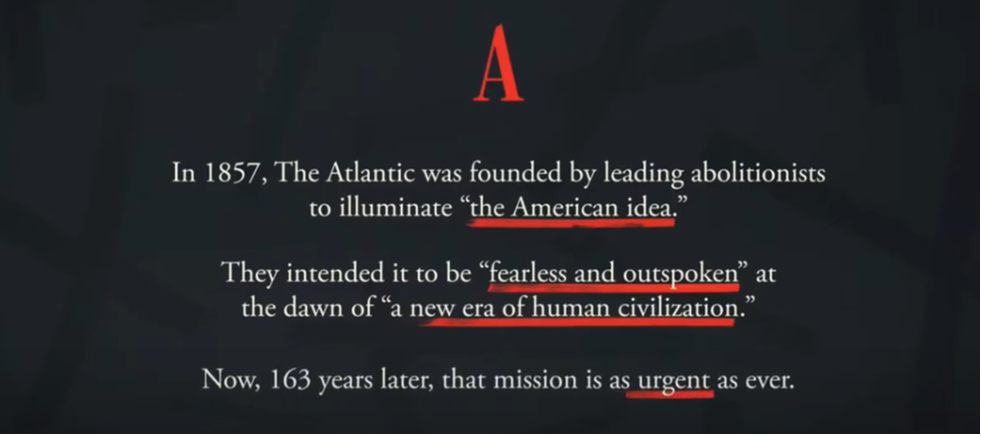
This has been a meandering way of introducing The Atlantic Festival. Earlier this week the historical Atlantic Monthly hosted a virtual version of their lively festival.
Here is how they won. They won on the content of diverse conversations and inclusion.
First, it was free. Subscribers had a few extra sessions and the ability to network but the important discussions were available for everyone. That decision alone has made me a subscriber for life. Go to YouTube and hunt down the videos. You are welcome.
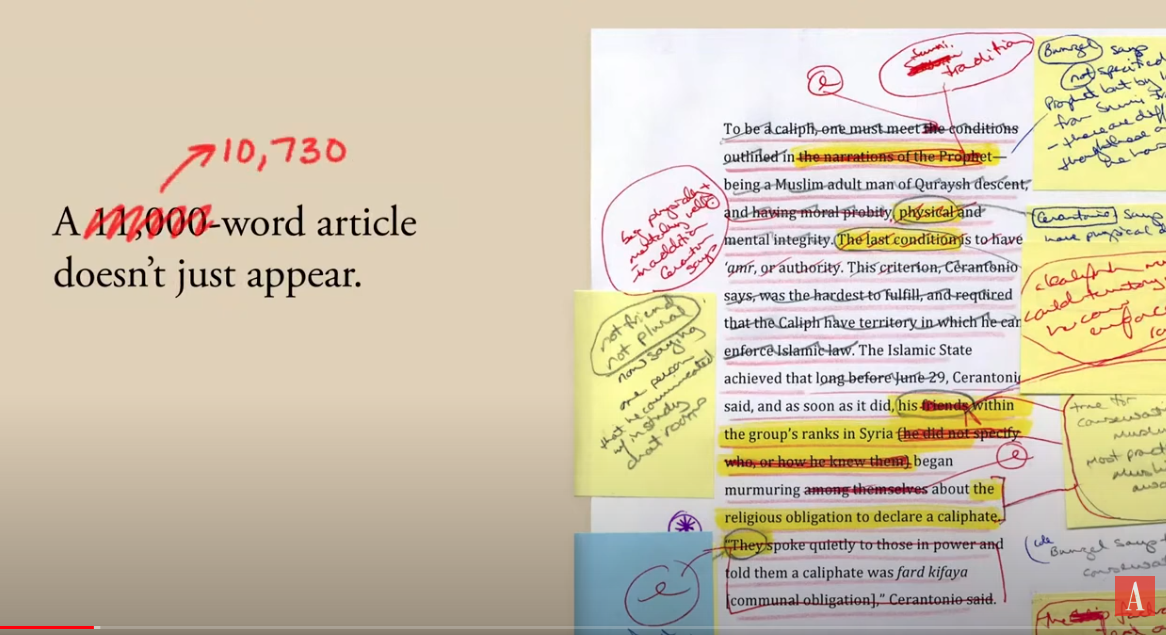
The journalists are the best in the world. I say that as a subscriber to Washington Post and The New York Times. It is our job, not just as colleagues but as readers to challenge and be informed. Not all journalism is created equal. I am haunted by a story by Barton Gellman.
Here is a link to the video.
Here is a link to the video.
The Interregnum comprises 79 days, carefully bounded by law. Among them are “the first Monday after the second Wednesday in December,” this year December 14, when the electors meet in all 50 states and the District of Columbia to cast their ballots for president; “the 3d day of January,” when the newly elected Congress is seated; and “the sixth day of January,” when the House and Senate meet jointly for a formal count of the electoral vote. In most modern elections these have been pro forma milestones, irrelevant to the outcome. This year, they may not be.--The Election That Could Break America
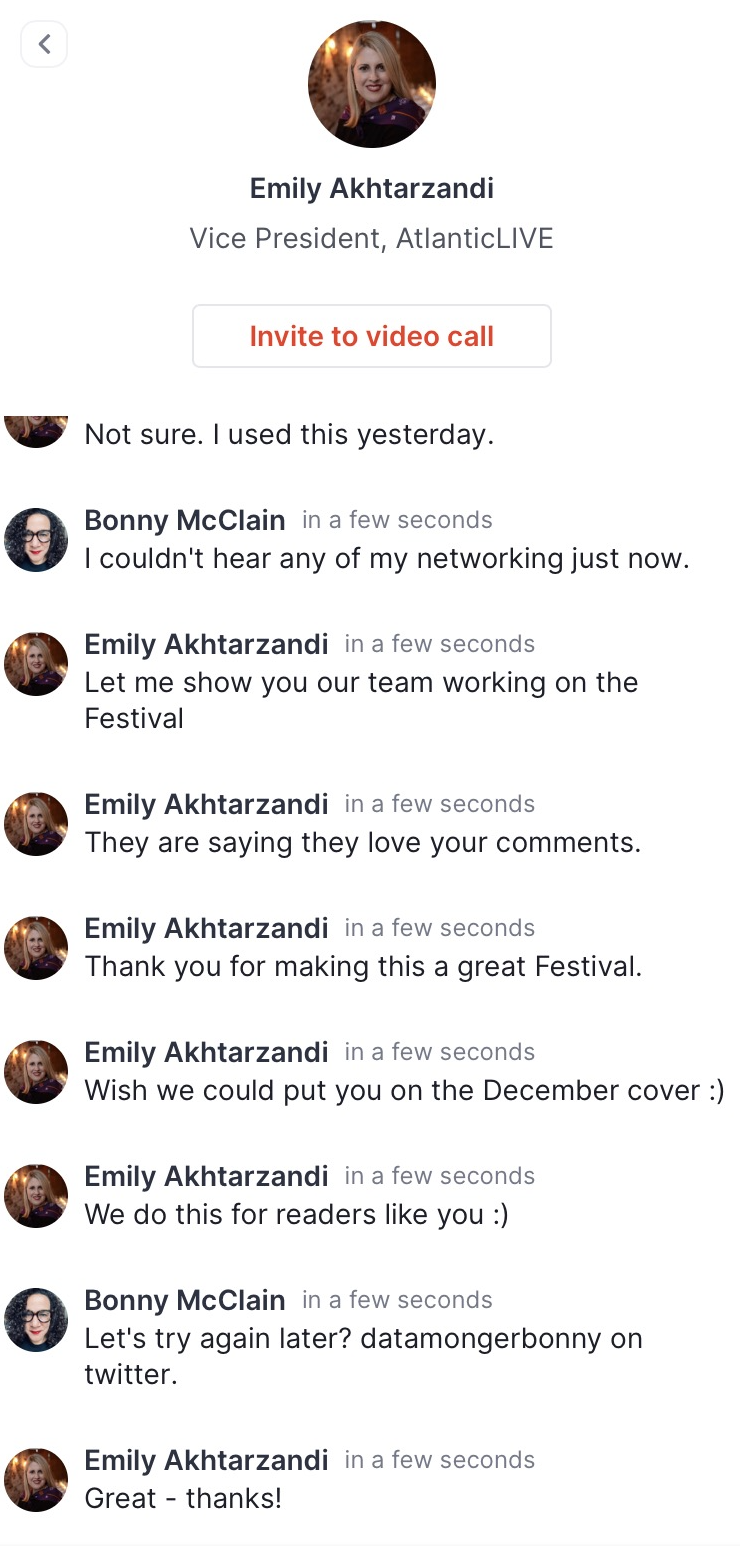 | Attendees spoke freely in the chat window where miraculously Atlantic staff were able to pluck out the questions among many of us simply connecting, sharing, and learning from each other. Topics included Election 2020, Equity, Inclusion, and a New World of Work, Visions for the Future of America, Bridging the Racial Divide, Bill of Health, Covid-19, State of Higher Ed, Reimagining the American Dream, and variations of these themes. I am lucky to be a journalist albeit a bit unconventional and a member of the National Press Club. Emily and team reached out to thank me. During a busy festival! This was a productive and amazing week. Its always a challenge to fit everything in a day but often when we pause and listen--we hear some pretty amazing things. Thank you to The Atlantic. |
I am invigorated. I have stories to tell and I will pursue my work examining poverty and relying on CENSUS data to tell the narrative of our communities. The ability to connect during these times of social isolation, and to gather synergistically in support of the principles of The Atlantic.
Its befitting that I can hear the ceremony for Ruth Bader Ginsburg broadcasting from the United States Capitol playing on NPR in the background. The words remind me of what we are now responsible for pursuing. The ideals and grace of one who served and achieved so much for all of us.
“tzedek, tzedek tirdof” meaning “justice, justice you shall pursue” (Deut. 16:20)
And we should be reminded that it takes all of us to contribute to the ongoing promise of the First Amendment.
 |
|
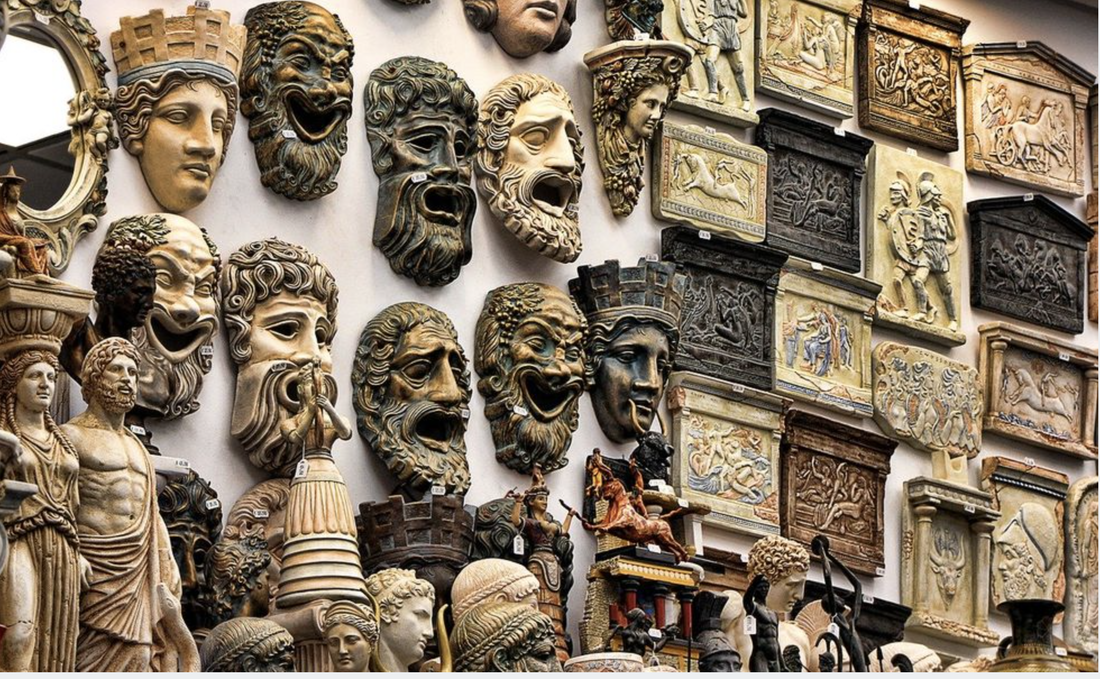
I like the quote but don’t recall much about Athenian tragedies. Apparently Sophocles was a bit of a naysayer or to use BCE lingo (before the common era)--a tragedian. I have a mist of recall around his magnum opus, Oedipus. The main point being if you defy the gods, prepare to suffer the consequences. Oh. And the king of Thebes (Oedipus) accidentally kills his father and marries his mother so there is that.
|
Continuing our theme of old is new again or “there is nothing new under the sun (Ecclesiastes 1:9)” creates the perfect segue to describe the main themes of a thought provoking documentary on Netflix. The Social Dilemma.
...The collective lack of understanding about how these platforms actually operate has led to hidden and often harmful consequences to society—consequences that are becoming more and more evident over time, and consequences that, the subjects in The Social Dilemma suggest, are an existential threat to humanity.--Netflix
After watching this movie you have to let it set in. How much of your behaviors are you willing to change? What curse has the ease of connectivity rained upon o' house? I doubt that any of us don’t know that we are the product being sold on these “free” platforms. But I’ll be darned if they aren’t entrenched into our lives in a seemingly intractable manner.
I am proud to say that I haven’t allowed notifications on my phone almost ever. I do get my texts because my family prefers them and there is an added bonus when I go on long runs. Siri whispers my texts into my ears. What could go wrong, right?
I also have disabled every modifiable opt-in, ad notifier, or tracker humanely possible. The list of apps requesting microphone or location permission is simultaneously funny and terrifying. I am talking to you Dropbox.
Here is another final push. Work more often on your platforms. Your website, your blog. I think I came to Instagram too late to see it as a business need. I post mostly when I travel but that has morphed into what I see along the trail or what I ate.
Super newsworthy.
In my experience, LinkedIn works as a conduit for messages to reach you. Many new clients simply reach out by message so that is the biggest advantage I can see there. Not much more.
Do you host webinars or synchronous/asynchronous meetings? The evolution of virtual commerce allows many of us to adapt and customize how we bring value. We have become Zoombies but maybe Loom can do some of that heavy lifting? I have been using it more and more when creating instructional asynchronous learning--check it out here.
Are there any lessons about connecting in a remote world to be learned from the past?

Well it just so happens...
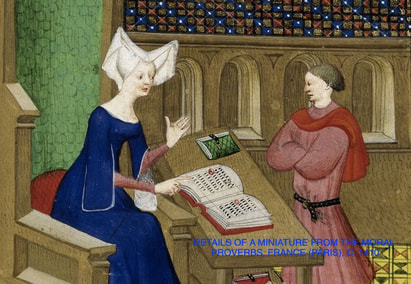
A Medieval Mother Tries Distance Learning
Esther Liberman Cuenca, September 17, 2020 Paris Review
This amused me. I am not sure why my mind has been wandering back so far--to times of pestilence, depravity, and demise of civilization--oh. wait.
Instead of Zoom, teachers in the Middle Ages had a feather off a bird and a sheet of parchment, and when the lesson came, it plopped down in front of you as a hundred-and-twenty-page Latin manuscript. And just what was a medieval mother’s education curriculum for her son?
Here is a simplicity we can embrace. Unplug and take a walk.
How you manage to pluck the feather off the bird is up to you but this is likely the only way to get off the grid. |
|
That is what the duchess, Dhuoda of Uzés, decided to gift her son. The Liber Manualis is a handbook of her wisdom, one that he should read, internalize, and apply to his own young life to navigate the complicated feudal politics of the age...He eschewed all her good advice on being a good vassal to his lord and got himself killed during a rebellion against Charles seven years after receiving her book. So Dhuoda’s curriculum didn’t help William much, in the end. But maybe it helped me understand, here in 2020, with schools shuttered for the fall semester, that advice given at a great distance can only ever go so far.
We can choose to heed warnings about our reliance on technology. I can’t remember the source of the advice but a conversation about AI and healthcare that seems so simple--if more folks would listen. Be cautious of AI that increases the distance between the patient and the provider. This is a metric I use when exploring biased algorithms and “shortcuts” in diagnostic pathways.
It is you, whose fate is grievous, who have chosen this; this fortune has not come to you from one more powerful; for when it was possible to show good sense, you chose to approve the worse, rather than the better fate.
(1095-1100, Philoctetes)
The newsletter--always free if you subscribe during September.
This blog stays free (and also ad free) but mumble|delegate|ponder will become paid (low cost but high value)...
Current subscribers will need to opt in to retain free status (simply hit subscribe).
Existing paying subscriptions have been automatically converted to new format.
Existing paying subscriptions have been automatically converted to new format.
The Ginsu knife commercials may have launched the current sh*tstorm of gimmicky selling techniques. Although I could argue that most of the current media darlings were all but a twinkle in somebody’s eye when this thing was first launched.
You might make an argument for jealousy directed towards these multimillionaire course creators or YouTube stars--okay true, true. But mostly I am mystified. I’ll step you though my 'n of 1' experience. Because I just didn’t see the “there” there.
Or to quote Jerry Saltz “Learn the difference between subject matter and content”.
Or to quote Jerry Saltz “Learn the difference between subject matter and content”.
When you look at art, make subject matter the first thing you see--and then stop seeing it. Start seeing into the art; find what needs are being expressed or hidden there, what else is behind the narrative. A work of art is a rich estuary of material, personal, public, and aesthetic ideas. Let its water pass through the banks to reach you.--Jerry Saltz--How to Be An Artist
When I read the quote I think of graphics and data insights but you can see it is applicable to almost anything trying to get your attention. There has to be substance or intrigue to capture interest right?
Full disclosure, I am creating a digital course. It is all content no glitz. I don’t wear a ton of makeup, grin and smile, or make sure my hands are held up as I count the insights you will gain. Someone somewhere said to be certain your hands are visible so now when you look at videos you can’t miss the jazz hands.
I have been doing a little research on platforms, style, all of the under-the-hood preparation. It makes sense that this little course would find its way into my inbox. I am curious.
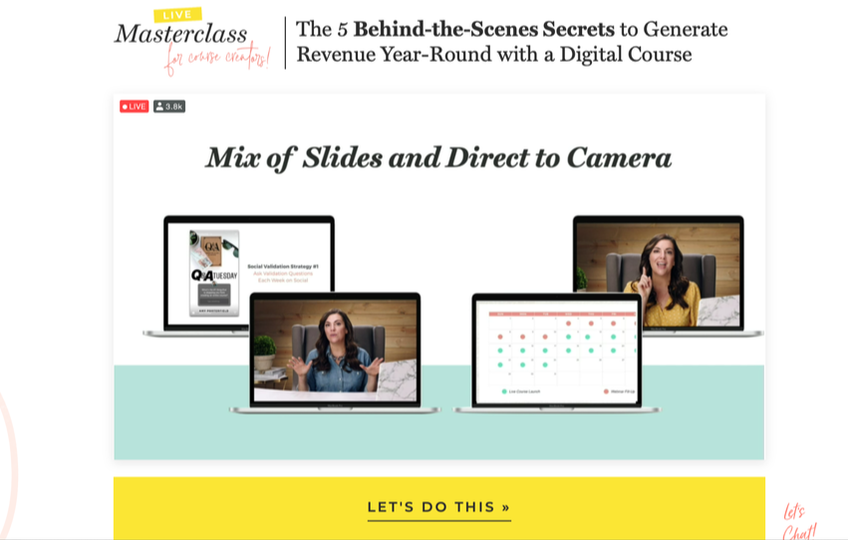
The woman in the video is a millionaire. She tells us how much money she makes and how she does it all with minimal effort, mentions her hunky husband, and also shares that she used to work for Tony Robbins. I can be a little critical because why would she care and let's face it--she laughs all the way to the bank.
The part that had me gobsmacked? There were almost 4000 people on this live “free” instructional video. I am not even sure what she sells but it seems like she is selling the idea of selling. If that was all, I would have simply thanked whomever forwarded the link perhaps muttering that it just isn’t for me. But...I was bored and started glancing at the chat comments.
For reference, my average class fees for learning technical and actionable skills in analytics run between $75 and $199. This entrepreneur was giving a bargain deal of close to $2000 dollars--to 4000 people--after telling them all directly how easy it all was for her and what a killing she makes.
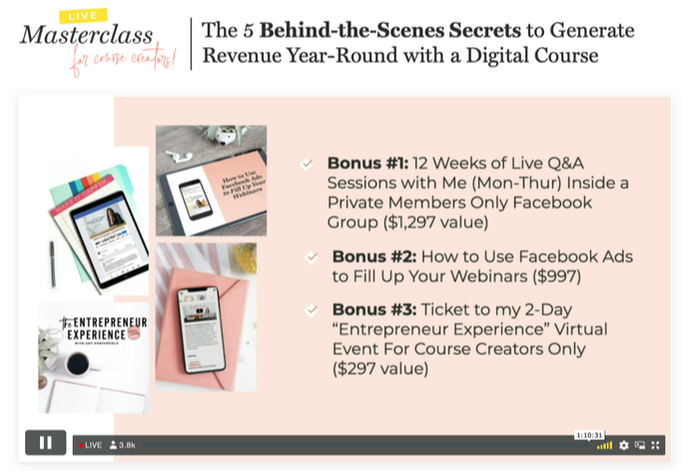
The audience was eating it up. Signing up left and right. Many were asking if they could split it between two credit cards, others were going to start driving for Uber or meal delivery services in their area. It was a little heart breaking if I am going to be honest.
I need to write about the experience because it has been occupying space in my brain. And even if it wasn’t, this little video arrived in my inbox this morning:
I need to write about the experience because it has been occupying space in my brain. And even if it wasn’t, this little video arrived in my inbox this morning:
| Friends, there aren’t any short cuts. It is all hard. I must have traveled to hundreds of conferences to speak or attend, taught dozens of workshops, and have several educational degrees. None of us know what the future will look like but trust me--it won’t be easy. Or if it was easy for you--well done. But the rest of us have a few lessons to learn. | |
Knowledge is knowing that a tomato is a fruit. Wisdom is knowing not to put it in a fruit salad.--Brian O'Driscoll
Sign up for our newsletter!
Browse the archive...

Thank you for making a donution!
